

Most retail analytics software was built for a buyer of the past. The category is dominated by tools designed for single-store retailers and e-commerce brands. The most common retail analytics platforms are ones that measure conversion rates, basket size, and foot traffic counts at the individual store level.
While these are useful metrics for a merchant deciding how to staff a Saturday shift or rearrange a window display, they're not incredibly helpful for scalable analysis and data-driven decision making for operators at multi-property destinations or ones with a million-plus square feet of leasable space.
These legacy platforms won't provide a holistic understanding of how your visitors moved through the property, where they got stuck, or what they searched for and couldn't find.
That gap between what retail analytics software measures and what property operators actually need to know is a category-level blind spot. And it's worth understanding why it exists before choosing your next tool.


How smart malls turn foot traffic into sales
Malls aren't dead. But the strategies behind driving mall revenue? They're critically out of date. This guide makes the case for the one tool most operators have systematically underestimated, and shows exactly how to use it to drive revenue at every stage of the visit.
What store-level analytics measure
Standard retail analytics tools track a well-established set of metrics:
- Foot traffic counts at entrances and storefronts
- Dwell time per store
- Conversion rates
- Peak hours
- Heatmaps generated from cameras or sensors at the entrance level
For individual retailers making merchandising and staffing decisions, this data is valuable.
Where this model breaks down is when property operators adopt the same tools and metrics by default. Foot traffic counts tell you how many people entered, but not where they came from or where they went next.
Dwell time per store doesn't explain why visitors never reach certain zones in the first place. Conversion rates are invisible to the landlord. The data exists at the wrong altitude for the decisions property teams actually make: lease placement, tenant mix optimization, signage investment, and renovation priorities.
The metrics that matter at the property level
Property operators need analytics that describe how a venue functions as a whole, not a rollup of individual store performance. Here are six metrics most retail analytics platforms don't measure, and why each one matters.
Zone-to-zone flow
This metric tracks how visitors move between areas of the property, not just in and out of stores. If 60% of visitors who enter the north entrance never cross to the south food hall, that's a layout problem, a signage problem, or both, but you'll never see it in store-level data.
Navigation success rate
Navigation success rate measures whether visitors who search for a destination actually reach it, and how long the journey takes. A visitor who searches for a store and gives up after three wrong turns is a lost sale for the tenant and a friction point the property team owns.
According to Mappedin's State of Venue Experience report:
That's signifies not a store-level problem but a property-level one.
Common path failures
These identify where visitors get lost, reverse direction, or abandon a destination entirely. These patterns reveal structural issues in the visitor experience that no amount of tenant marketing will fix.
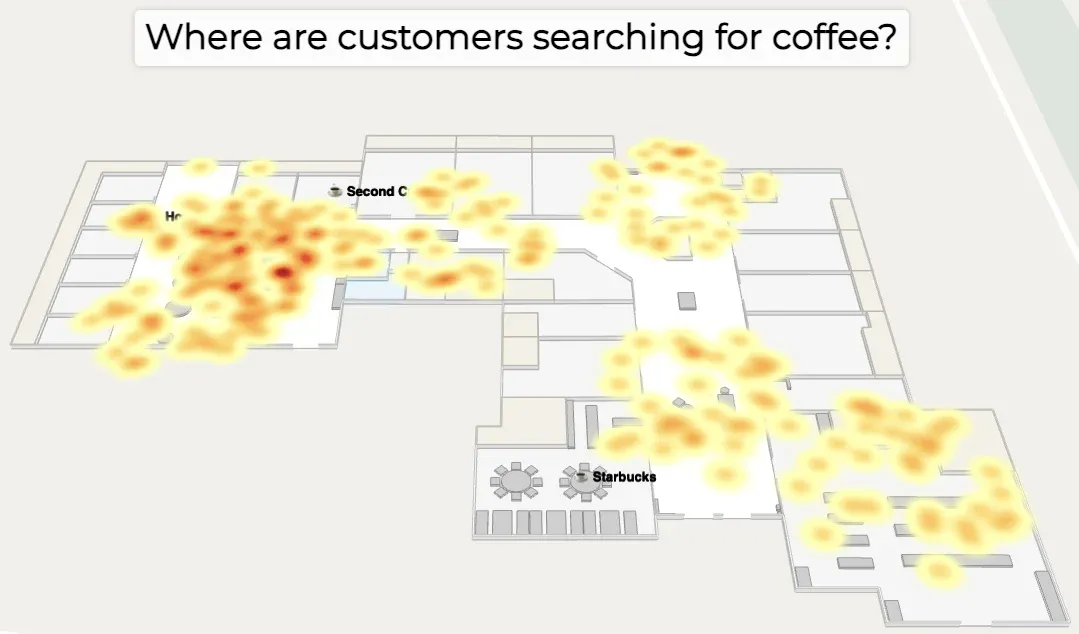
Search-to-visit ratio
This metric compares what visitors search for against where they actually go. If a tenant shows high search volume but low visit completion, the issue is probably wayfinding, not demand.
Spatial layout impact on tenant performance
This separates brand strength from physical position. Is a tenant's foot traffic driven by their brand or by the fact that they sit next to the main escalator? Property teams making lease renewal decisions need to distinguish between the two.
Wayfinding engagement
Engagement tracks how often visitors use digital maps, which destinations they search for, and how that correlates to visit patterns. This metric closes the loop between what visitors intend to do and what they actually do inside the venue.


How smart venues can turn insights into revenue in 2026
With access to smart visitor analytics, customer experience and operations teams can turn insights into revenue. In this conversation, Michael Pasket, VP of Malls and Jere Suikkila, Solutions Architect reveal how leading venues use mapping and analytics to bridge the visibility gap between digital and physical experiences.
Why single-store tools don't serve complex, multi-tenant environments
Three architectural limitations explain why retail analytics tools designed for individual stores can't produce property-level insight.
1. The data model is wrong.
Store analytics treats each location as an independent unit. Property analytics needs to understand relationships between locations: how proximity, floor placement, and routing paths create dependencies between tenants that don't show up in isolated store metrics.
2. There's no spatial layer.
Most analytics platforms ingest POS data, camera counts, or WiFi pings, but have no understanding of the physical layout. They don't know that two stores 200 feet apart are separated by a dead-end corridor, or that a food court on the second level has no visible signage from the ground floor.
3. Aggregation isn't flow.
Adding up store-level metrics doesn't produce property-level insight. Knowing that 40,000 people visited the mall today tells the operator nothing about how those visitors distributed across zones, where bottlenecks formed, or why certain corridors consistently underperform.
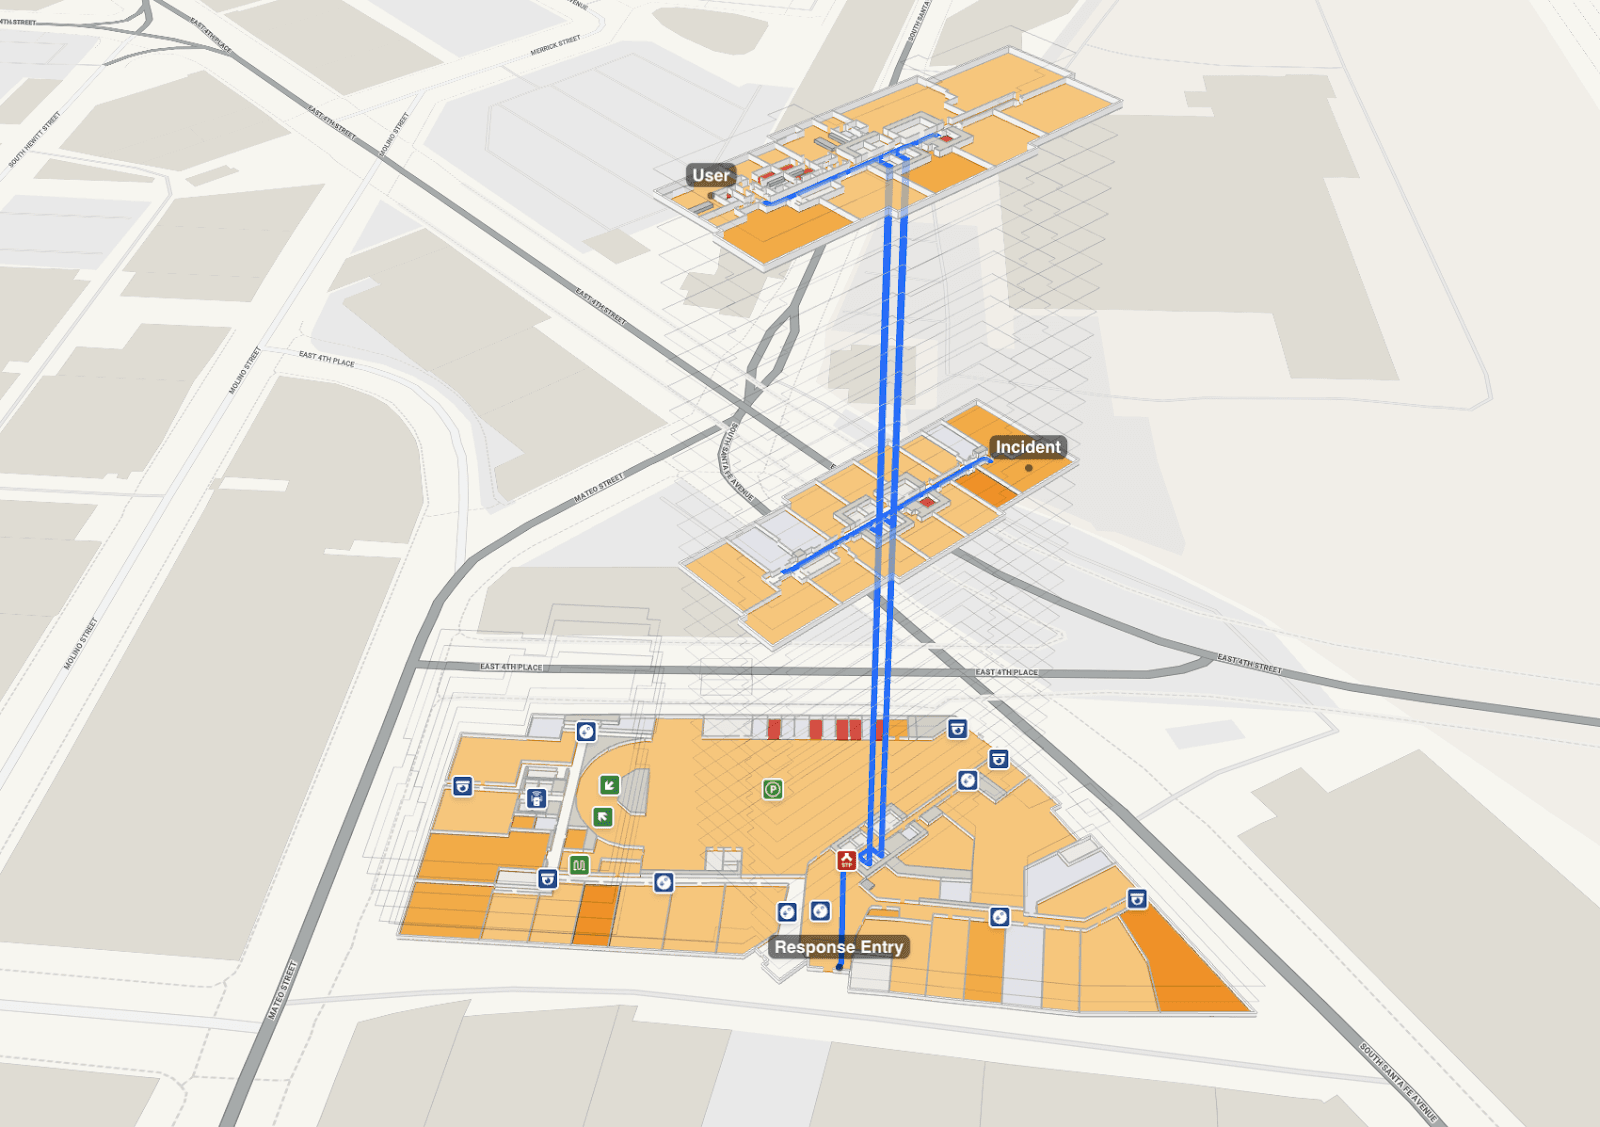
What spatial analytics adds to the picture
Spatial analytics is the missing layer: analytics that understands the physical environment and connects visitor behavior to the built space they're moving through. Instead of counting visitors at a threshold, spatial analytics captures movement patterns, navigation intent, and the relationship between where people want to go and where the building takes them.
This layer turns movement data into property decisions. When you can see a specific navigational bottleneck in a certain corridor, your team can make a signage investment decision backed by behavioral data. When search data shows that a new tenant generates high intent but low visit completion, you know the issue is discoverability, not demand.
How Mappedin helps
Indoor mapping platforms generate this data natively because the map is the interface visitors actually use. Mappedin captures navigation behavior like search queries, route completion rates, destination popularity, and engagement patterns, as a byproduct of the visitor experience. Because the data comes from real visitor interactions with the map, it reflects actual intent rather than behavior inferred from WiFi signals or camera estimates.
Plus, Mappedin's pre-configured dashboards surface this data across four layers:
- Usage overview
- Behavioral insights
- User engagement
- Content performance
The behavioral insights layer, which surfaces most-searched destinations, common navigation paths, peak traffic windows, and drop-off points, is the one that directly informs store placement decisions, tenant conversations, and operational adjustments. For teams with more sophisticated needs, a Snowflake integration puts raw wayfinding data into your existing BI tools alongside POS data, loyalty platforms, and customer satisfaction scores.
— Patrick Flanagan, SVP, Digital Development, Operations & Strategy and Data Protection Officer, Simon Property Group
Most retail analytics tells you what happened at the point of sale. Spatial analytics fills in the gap before that moment. When that data flows into the same ecosystem as the rest of your retail intelligence, you stop guessing at the connection between the physical experience and business outcomes.


Share