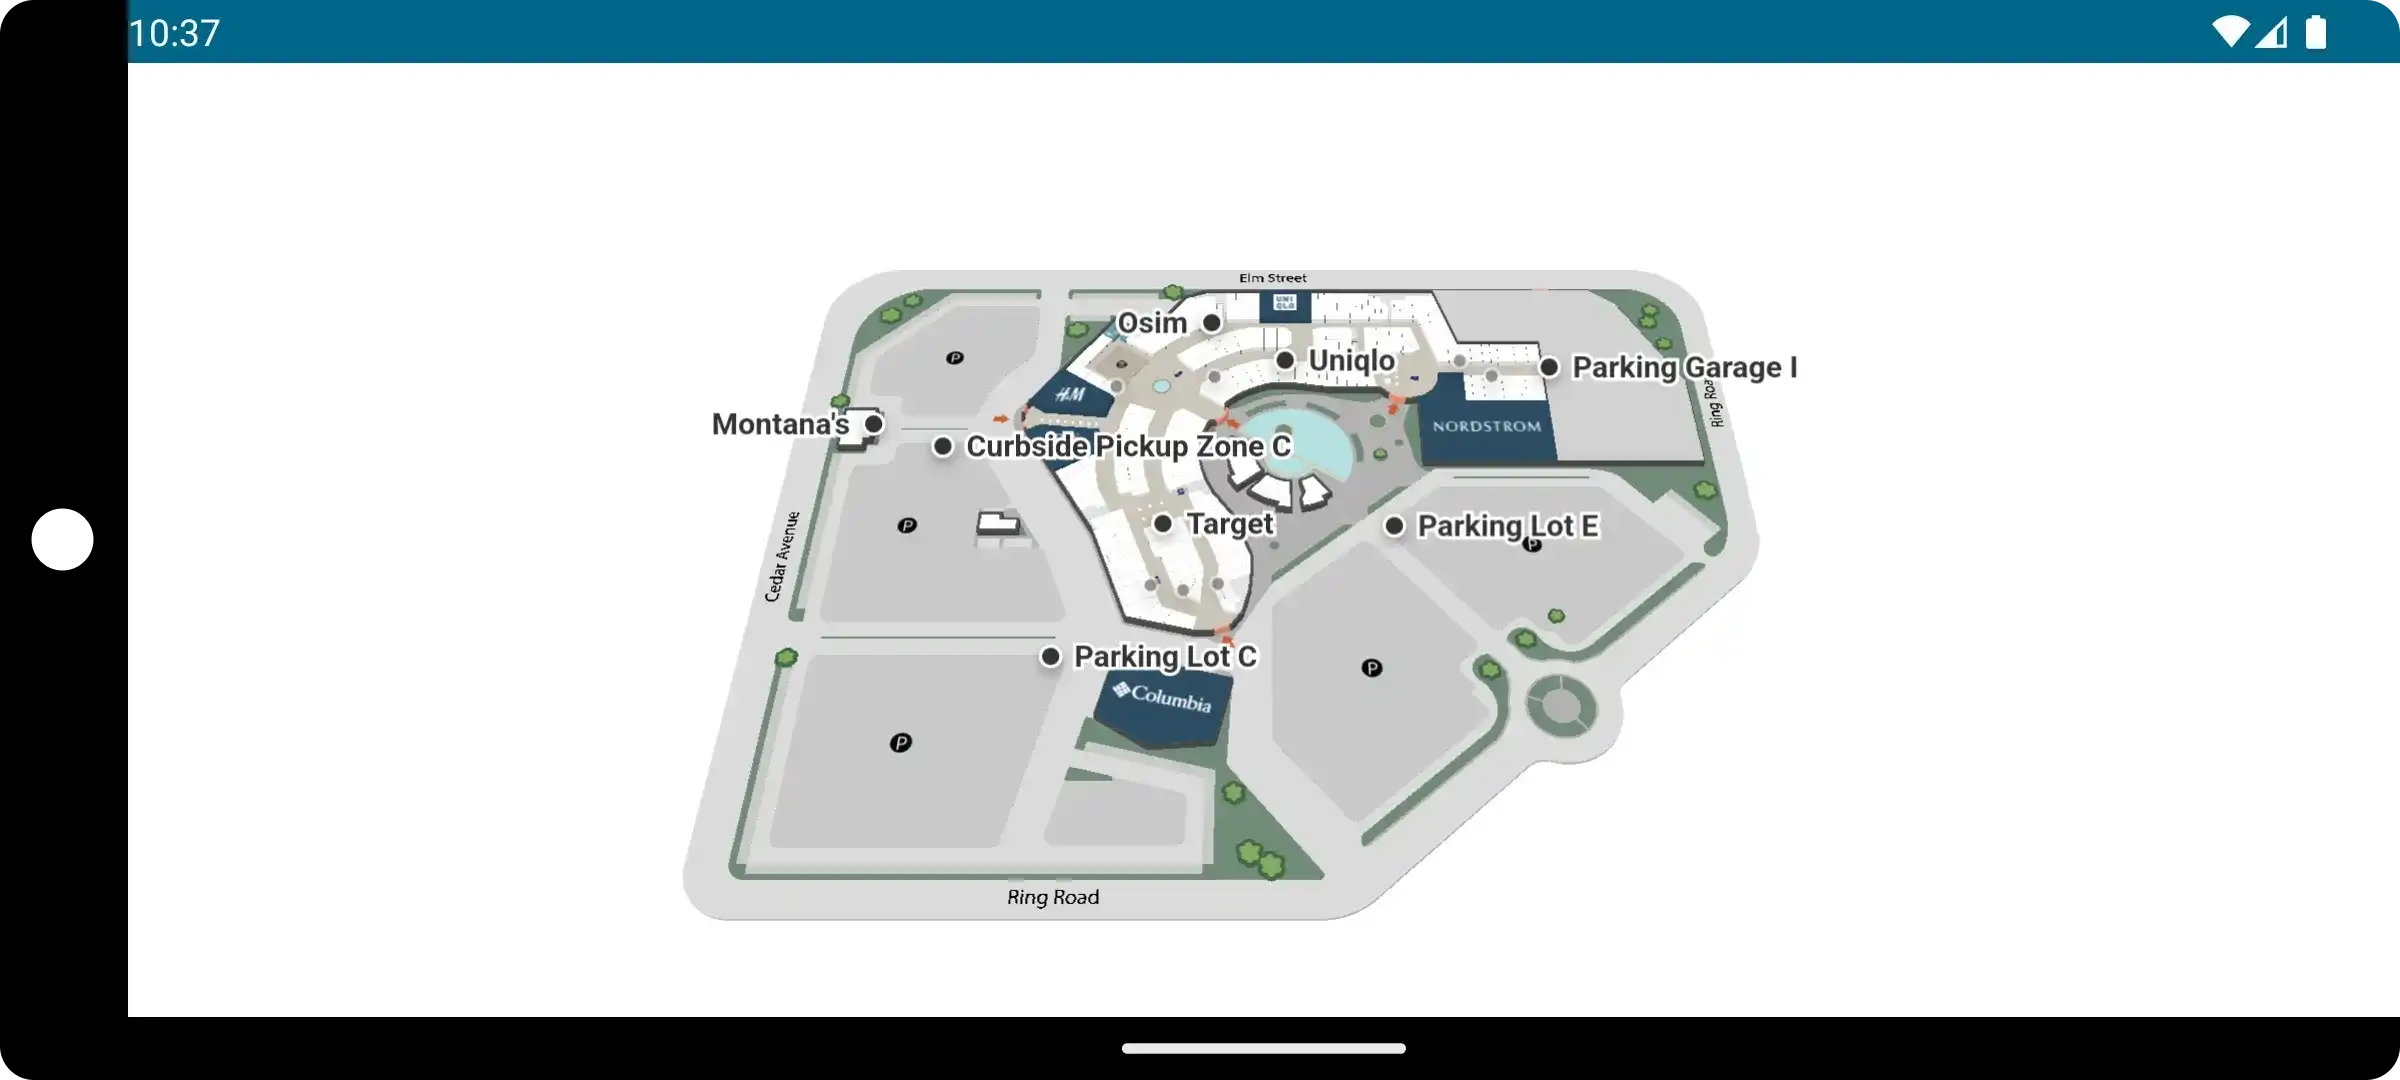
The Mappedin SDKs give you the tools necessary to create exceptional indoor mapping experiences. With a comprehensive list of features and a straightforward map editor, it’s never been easier to build a fully custom application to suit your specific use case. Take your product further by leveraging the robust analytics features offered by Google Firebase to gain valuable insights on your map’s usage.
It requires minimal effort to integrate Firebase or any other analytics provider with the Mappedin Web SDK. The majority of your existing code will remain untouched and functionality will not be altered. We will simply add additional function calls to log desired analytics events we wish to track.
Prerequisites
In this guide, I will assume you have initialized a project and have a working knowledge of the Mappedin Web SDK and TypeScript. If this is your first Mappedin project, I highly recommend you follow our Getting Started with Web SDK guide and familiarize yourself with some of its features. As I refer to specific topics I will direct you to the guides where you can read more, however, this blog will primarily focus on the integration with Firebase.
Firebase setup
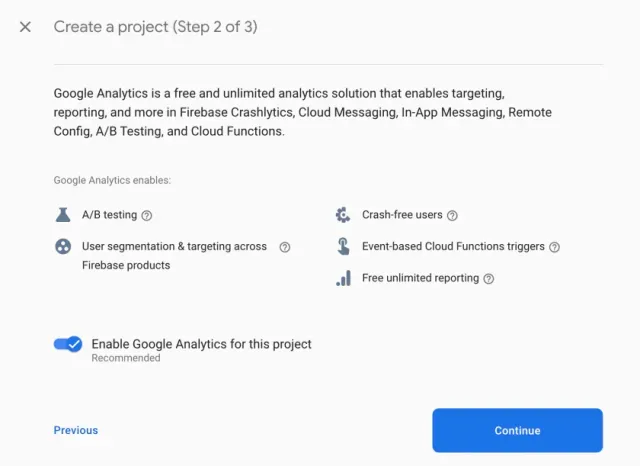
If you haven’t already worked with Firebase, begin by creating a new Google Firebase project. During setup, ensure that the “Enable Google Analytics for this project” checkbox is selected. If your project has already been set up without Analytics, refer to this article on the Google Support forum to link a Google Analytics 4 property.
Once you have done so, be sure to install the Firebase SDK in the same project which you have the Mappedin Web SDK installed. Gather your keys for the Firebase config and initialize both the app and analytics shortly after the mapView initialization.
With just these few initializing lines, your integration is ready to go and you can begin logging user events in your project. Next, let’s have a look at some of the Mappedin SDK events which you might find useful to log analytics for.
Logging events
Selection
As a facility manager, you absolutely want to know what locations customers are selecting so you can provide them with better recommendations and a better experience. Using the Mappedin Web SDK, you have full control over what happens when a location has been selected. This is the perfect opportunity to log a user interaction and discover which locations to show first and which locations need more attention.
The above code captures a polygon click and retrieves the locations associated with it. The location name is then sent to the analytics dashboard as a select_content event type. You can read about the recommended event types for Google Analytics in their Help Center post titled Recommended Events.
Search
Another vital place to log events is when a user performs a search. The Mappedin Web SDK provides an offline search function which requires no internet connection to index the locations. Configuring and displaying search results is covered in detail on the Developer Portal and adding a user analytics event to this is a trivial process.
This event logs the user's input as each new character is entered into the search field with the recommended search analytics event. There’s plenty of room to add additional logging for result selection or lack thereof.
Directions
Simple and intuitive A to B wayfinding is at the core of the Mappedin SDK. Just like in the previous two examples, you’ll want to integrate analytics to log where users are coming from and where they’re going. After selecting a start and end location on the map, generate the directions and log the Firebase analytics event.
You may notice that the generate_directions event doesn’t appear in the list of recommended events outlined in the Google Analytics Help Center. This event is too specific to a mapping use case to fit general recommendations. Thankfully, Google supports custom events which can be used to log any parameters you need.
The above examples should help get you started logging Mappedin Web SDK events using Firebase. The types of events you log will be specific to your own use case, so feel free to experiment and learn more about your end users’ experience.
Debugging events
In Google Analytics 4, it can take anywhere from 24-48 hours for data to appear in your Firebase dashboard. To circumvent this and view your analytics in real time, you’ll need to access DebugView in Firebase.
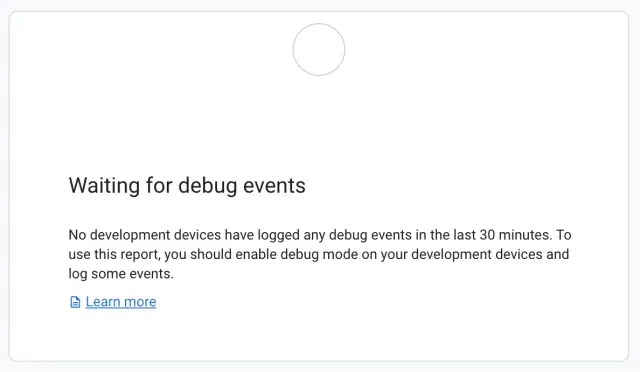
If you open the view right now, you’ll notice you’re still not receiving any data in the stream. To send debug data from your Mappedin app to Firebase, you first need to add the official Google Analytics Debugger extension for Chrome to your browser.
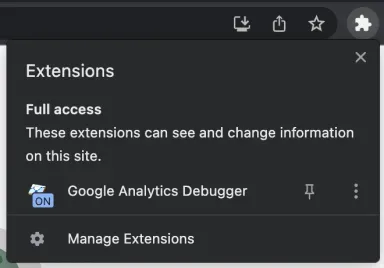
Once installed, navigate to your application. With the same browser tab open, select the Google Analytics Debugger extension from the extension list. The current page should automatically refresh. You’ll know the extension is running because the small extension icon will change to say “ON”.
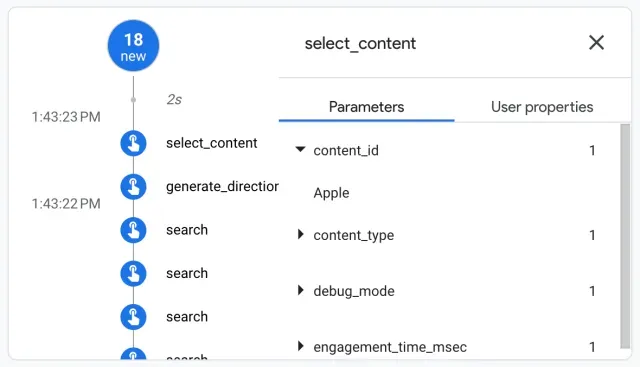
With the extension running you should begin testing your events and ensure they log analytics as expected. Select locations, search, and generate directions. The DebugView in Firebase should display these events in near real-time as they happen. Google recommended event types support expanding their parameters to view finer detail, such as the location name provided to the content_id field in the select_content event.
To get the most out of DebugView and its features, have a look at the official article in the Firebase Documentation.
Viewing events in the dashboard
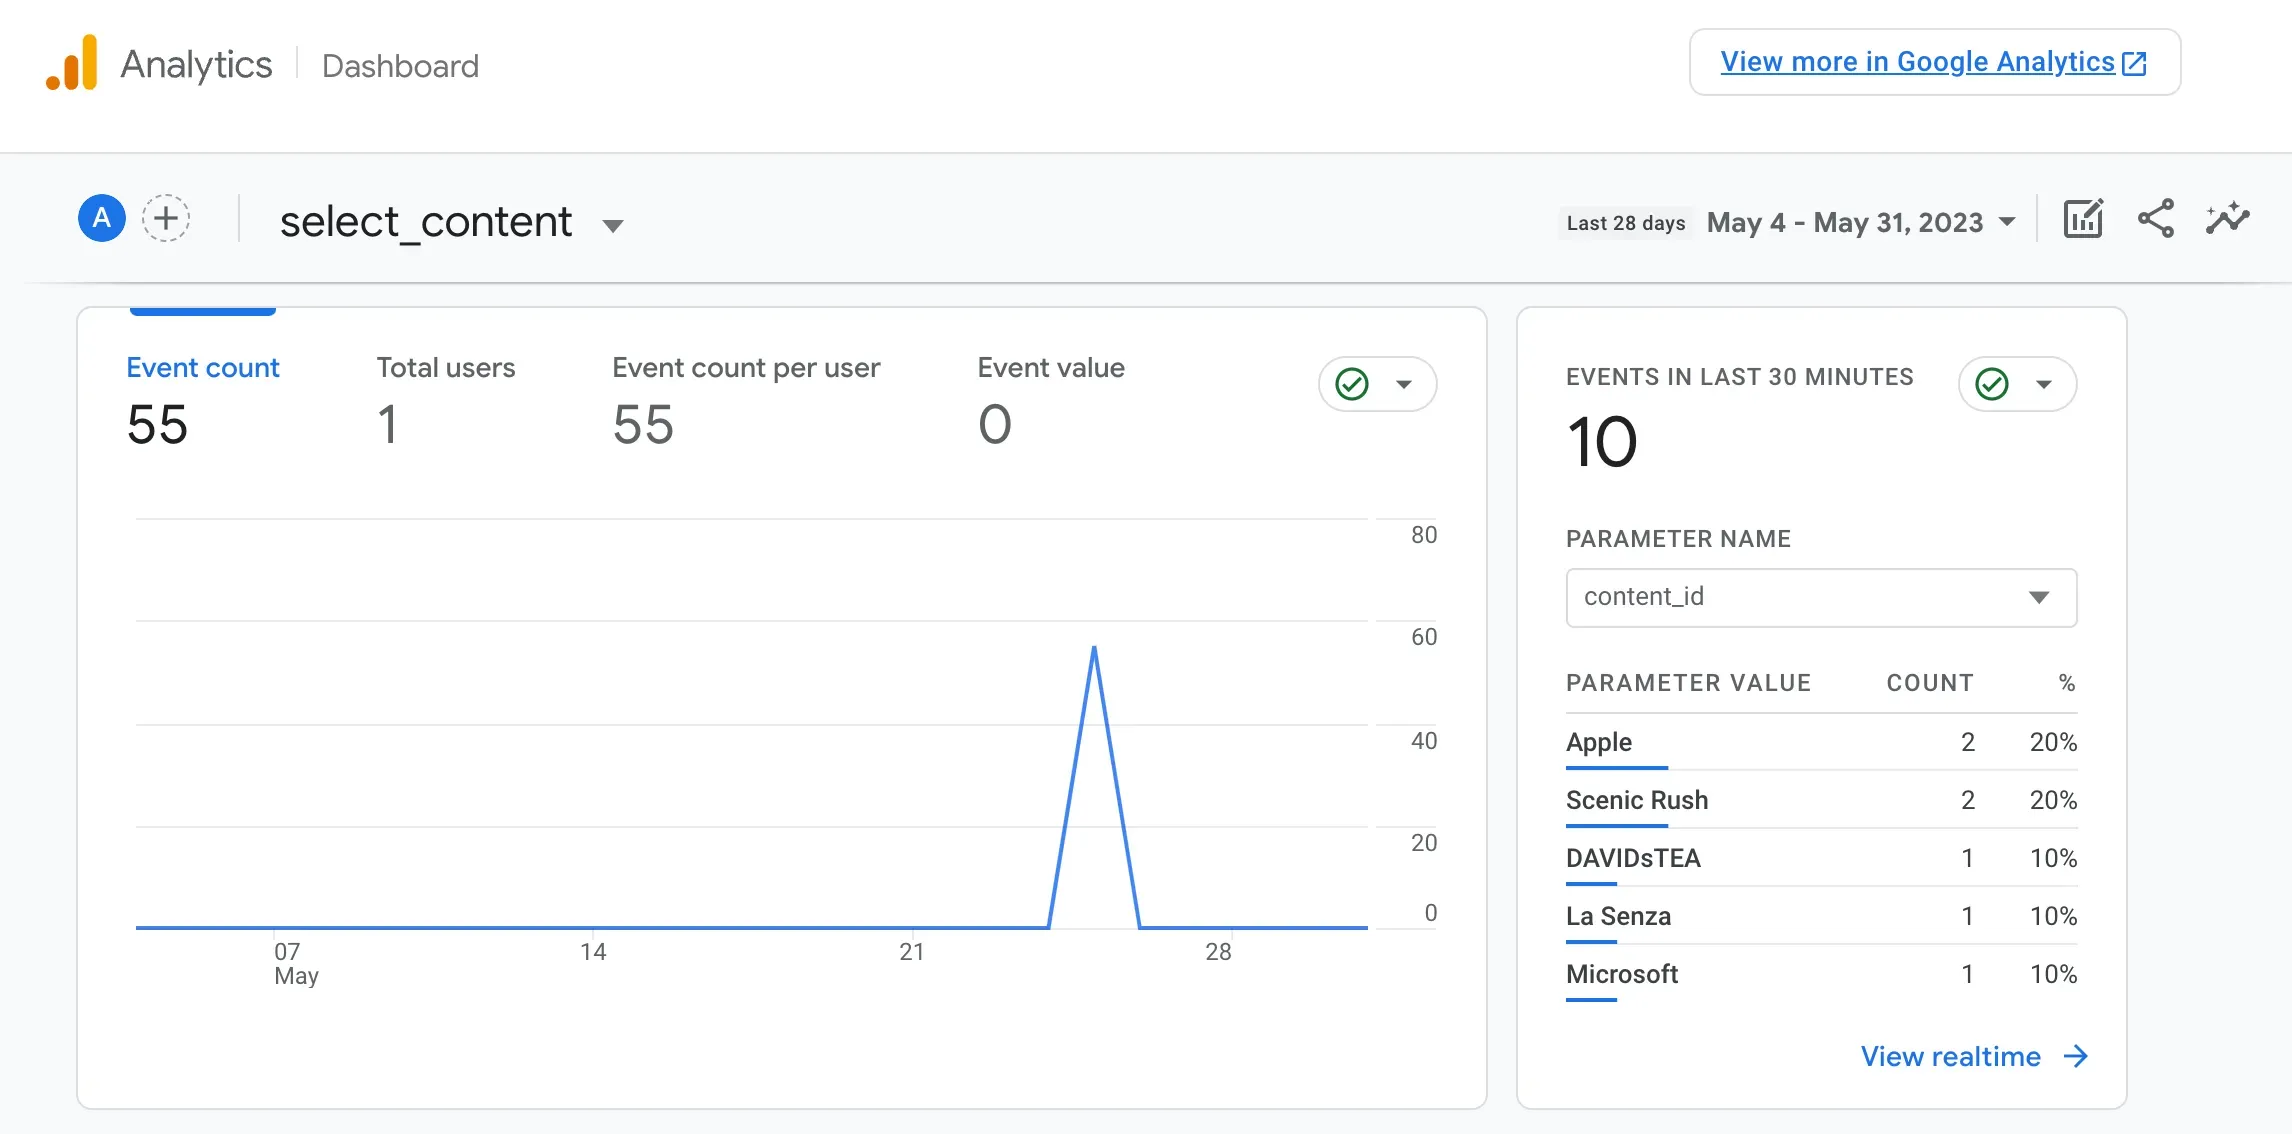
After some time has passed, analytics events should begin populating the Firebase console. The resulting data is located in the Events dashboard. Using the dashboard, you can track interactions with the map over long periods of time and begin executing on those metrics. Below we can see all the selected locations, the spikes in usage, and the popularity of each location.
It really is that easy to integrate Google Firebase into your Mappedin Web SDK project. Integrating analytics events like these into your map will help empower your team to make data-driven decisions and optimize the user experience. Not a Mappedin SDK customer? Contact our team to get started building your own indoor map application.
Share