

Picture the scene. A prospective tenant sits across from a leasing agent. The floor plan is a printed PDF, annotated in pen from the last few meetings. The agent traces a finger across the page explaining adjacencies, sketching zones, describing what a space could look like. The prospect nods, says they'll think about it, and leaves.
The deal is still alive. But it just got slower.
Leasing is a spatial sales process. More than most people acknowledge, the ability to close a deal (and close it at the right rent) depends on how clearly and quickly a prospect can visualize what they're buying:
- The space itself
- What surrounds it
- How it fits into the mix
- Why the adjacencies work in their favor
When that picture is hard to form, deals take longer. When it's easy, they don't.
The commercial real estate leasing industry has been running on tools that were never built for this conversation. Property management systems track deals, spreadsheets track availability, and design teams produce static floor plans on a timeline that rarely matches the pace of negotiations. Then in the meeting room where the decision happens, the leasing agent is still often working from a printout.
This is starting to change, and the leasing executives leading it are thinking about the problem differently than they were even five years ago.
What a commercial real estate leasing strategy starts with
Alex Jones has spent roughly 30 years on both sides of the leasing table, building portfolios for some of Canada's largest pension fund-backed landlords (Oxford, Ivanhoe, Cadillac Fairview), running global real estate for Roots Canada, and leading real estate strategy at McDonald's Canada. He now runs Omada Inc., an advisory that works with retail brands and CRE companies on growth strategy.
In a recent episode of Mall Talkers, Jones was direct about where leasing strategy has to begin, and where most people get it wrong.
That sequencing matters more than people give it credit for. Customer clarity drives merchandising vision, which drives the prospect list, which in turn informs physical requirements and development decisions.
When mixed-use developers skip this (or rush it), the consequences show up in awkward podium retail that never leases, or premium units that sit empty because the spatial layout can't accommodate the tenants who would actually make the project work.
The mistake Jones sees most often is one of overconfidence:
The tenants are what people come to see. Not the building.
The art and science of the 10-year bet
Leasing is also a long-duration business, and that's what makes the data-versus-gut question genuinely complex. Signing a tenant to a 10-year deal means betting on a brand's trajectory, not just its current performance.
Jones described watching the premium denim category come and go.
The landlords handling this best are the ones who have found a way to blend the analytics their best tenants bring into the room with their own read on trend and market timing.
Jones was part of the team that pioneered this deliberately when opening CrossIron Mills in Western Canada.
The ability to hold space for the right tenant at the right moment is increasingly foundational to how strong assets are managed. It requires a clear, current picture of what the portfolio actually looks like at any given time, which is where the tools start to matter.


Stop filling space, start allocating capital
Andrea Boris Hipeco has spent more than 18 years in retail real estate across Europe, working with Sonae Sierra, Neinver, Unibail-Rodamco-Westfield, and CPI Property Group before taking on his current role as Head of Leasing Europe at Multi Corporation, where he oversees leasing operations across 15 countries and a portfolio of more than 60 malls representing roughly €5 billion in assets under management.
In his Mall Talkers episode, Leasing: How to Stop Filling Space & Start Allocating Capital, Hipeco puts it plainly:
The shift in framing from occupancy management to capital allocation has significant downstream implications for how leasing teams operate, how they evaluate deals, and what tools they actually need.
Why Occupancy Cost Ratio (OCR) is the wrong metric for tenant health
Much of the commercial real estate leasing industry still leans heavily on OCR as its primary indicator of tenant health. Hipeco's argument is that this is masking real risk.
The Zara example he used illustrates this clearly. Zara is moving upmarket:
- Less merchandise per square meter
- Higher price points
- More assisted selling
- Significant investment in logistics
That strategic shift changes the store's cost structure substantially, and in ways that don't surface in an OCR comparison. The same OCR number for Zara today tells a different story about store-level profitability than it did five years ago.
His solution is a dual-sided model:
- A P&L analysis of the tenant alongside a return analysis for the investor.
- A range of deal structures that fall within what he calls "green dots" — the equilibrium zone where the deal works for both parties.
He's built this as an Excel model for his team. His EBITDA-based approach reduces the margin of error on tenant health assessment to 4–5%, versus swings of half a million euros or more under OCR-based analysis of the same tenant.
The point isn't that OCR is useless, but that relying on it alone creates a false sense of security, making it harder to have honest conversations with tenants about what a sustainable rent truly looks like for both sides.
Every lease is a capital allocation decision
As Hipeco says,
Approached that way, the leasing function sits at the intersection of asset strategy, tenant relationship management, and commercial intelligence. It's not a transaction function that hands off at signing, but rather an ongoing portfolio optimization function, and the best operators are starting to structure their teams accordingly.
Hipeco gave a concrete example from his own practice. A tenant came to him asking for a rent discount because sales were underperforming. Before agreeing to anything, he pulled the traffic data. People were passing the store. They weren't entering.
"You are in one of the best places in the mall," he told them. "The problem is that we need to communicate more that you are there."
A co-branded marketing campaign went live. Within two months, sales started recovering. The discount conversation disappeared.
Active asset management where the landlord and tenant are genuinely working from the same data changes the relationship from transactional to collaborative.

Why commercial real estate leasing software falls short of the presentation room
Both Jones and Hipeco are describing a leasing function that demands better information, faster, about the portfolio, tenant health, and what the space actually looks like to a prospect sitting across a table. The industry broadly agrees with this direction, but the tools haven't quite caught up yet.
Most commercial real estate leasing teams are running on a fragmented stack. Property management systems like are built for deal tracking and accounting, but don't connect to the whole picture.
Spreadsheets track availability but can't show adjacencies. Marketing teams produce polished floor plan materials, but the turnaround time when a unit changes status can stretch to weeks.
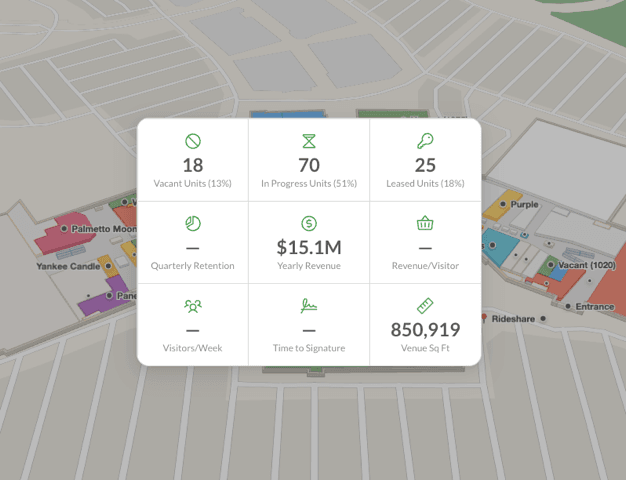
Some larger operators have addressed this by building bespoke powerful internal visualization tools which can often overlay data points across a portfolio:
- Tenant mix
- Vacancy
- Foot traffic
- Demographic data
The downside is that they're often expensive to build, expensive to maintain, and out of reach for most leasing teams.
The result is a tool gap that shows up most acutely in the meeting room. A leasing agent can prepare extensively, but when the prospect asks which floor has the best foot traffic, the answer often requires a follow-up. The friction often leads to a deal delay, and in a market where time-to-lease is a direct cost, deal delays compound.
What an interactive leasing map changes
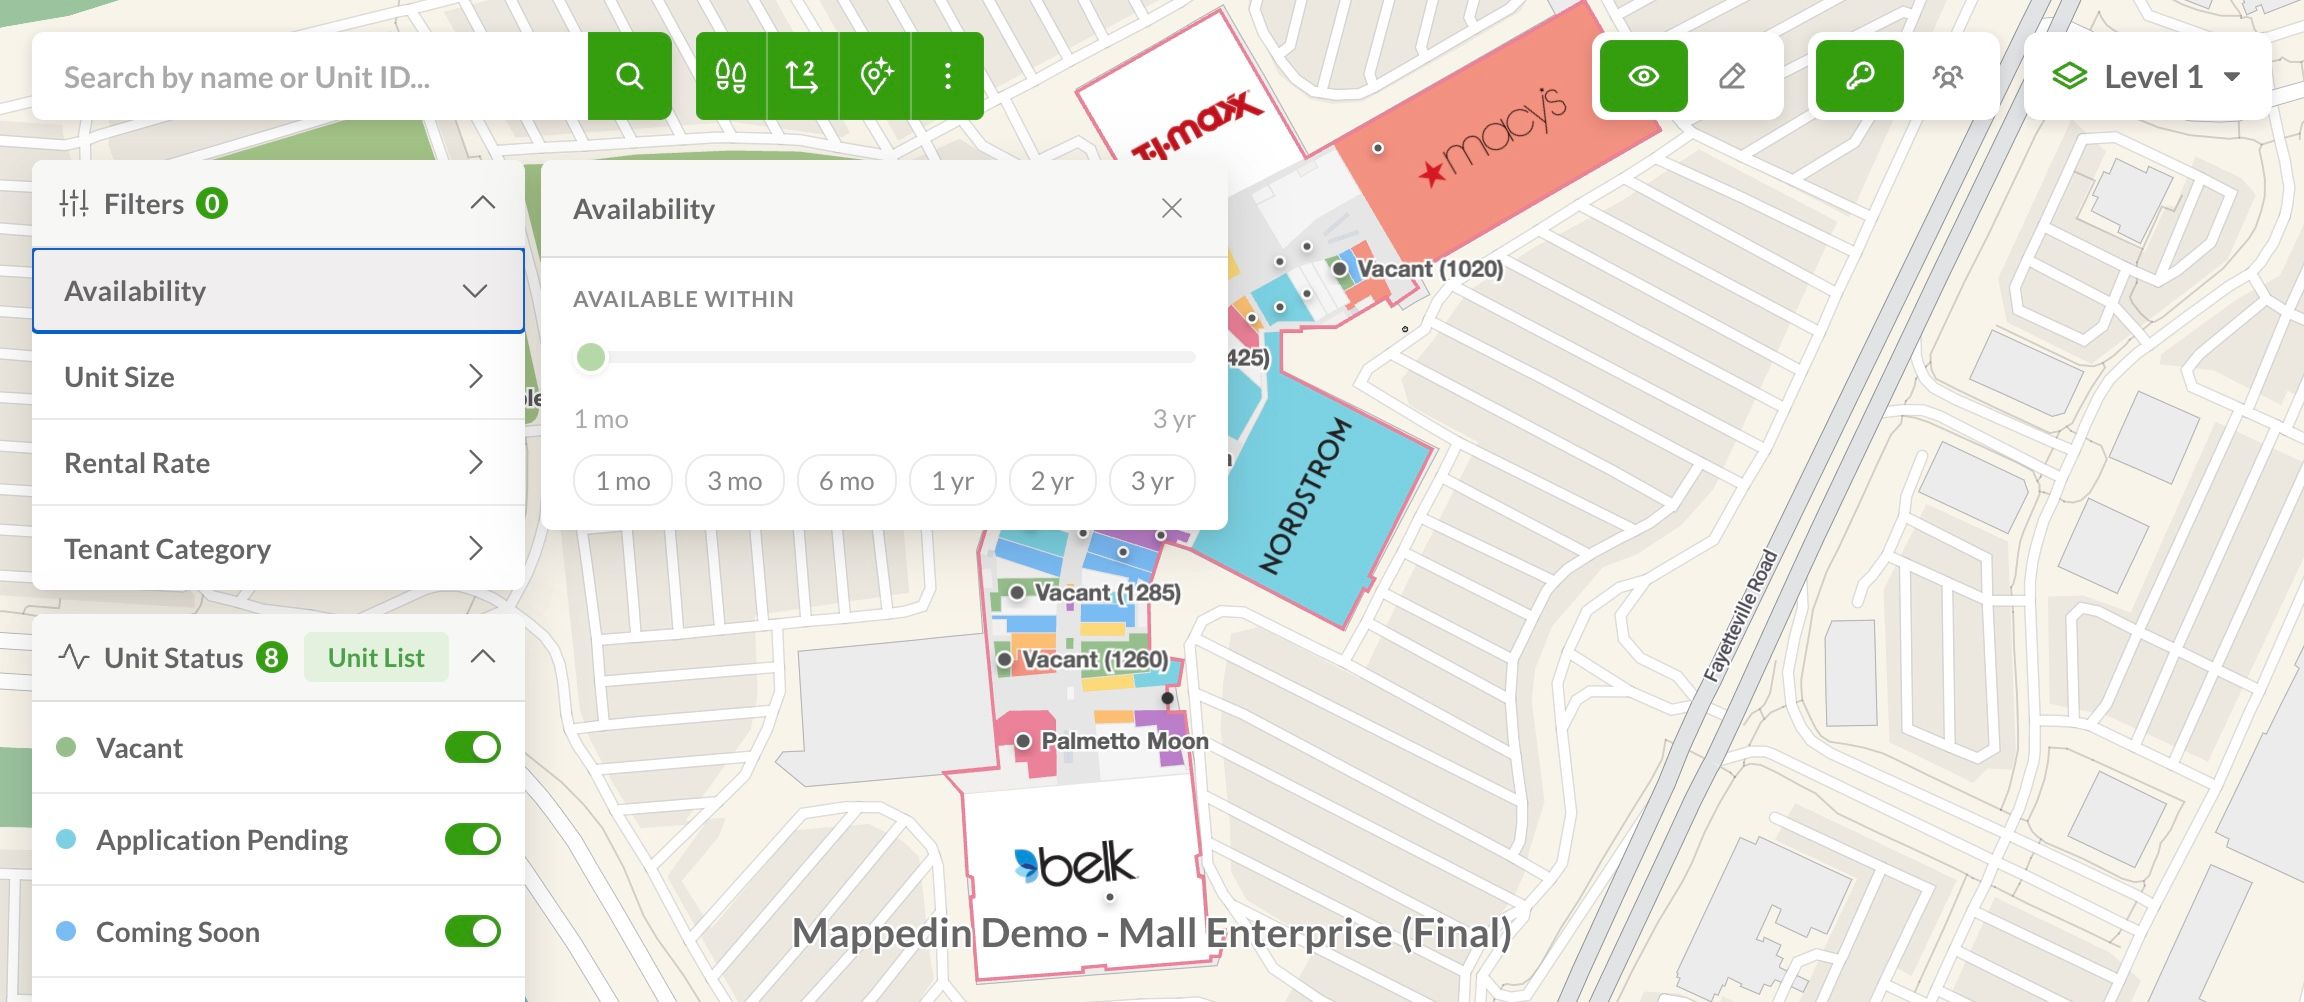
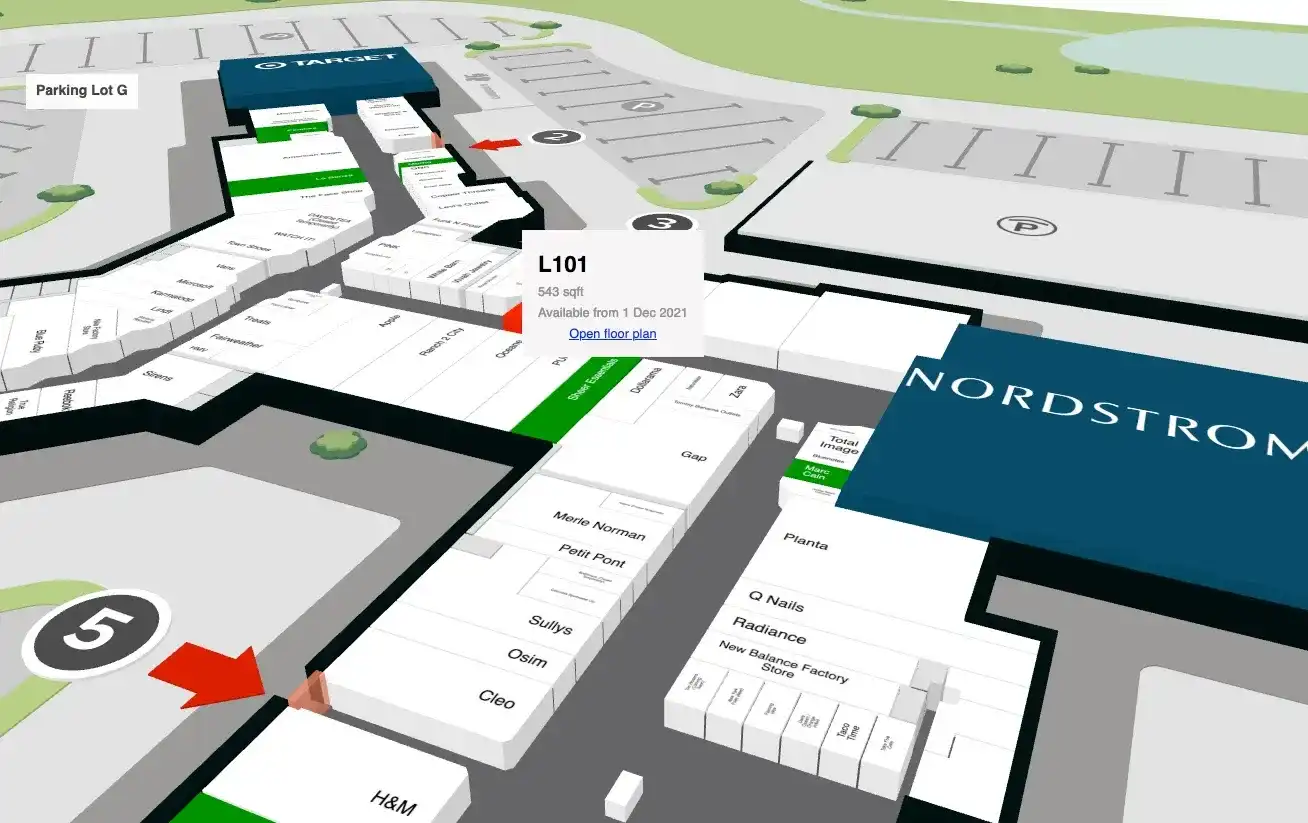
The concept of an interactive leasing map like Mappedin Leasing addresses this gap, giving the leasing agent a single, live view of the property that can be navigated, filtered, measured, and shared in real time.
In practice, this means:
- A 3D rendering of the property with units color-coded by leasing status
- Searchable by unit name, size, rental rate, or tenant category
- Ability to measure square footage and walking distances between units in seconds
The shift this creates in the leasing conversation is less about technology than it is about clarity. LOI negotiations stall when tenants lack clarity or need to return for another site visit. A leasing presentation that can answer spatial questions in the room rather than generating a follow-up action item keeps momentum where it matters most.
When lease plans change monthly and kiosk configurations turn over faster, a static PDF floor plan is always behind. A living map eliminates the lag.

Share