Start Here
Modern stadiums can't optimize what they don't measure. This guide breaks down 20 actionable KPIs across seven critical categories including wayfinding, accessibility, and monetization that leading venues use to transform fan navigation into revenue opportunities, reduce operational costs, and boost satisfaction scores. With 42% of fans willing to spend over $250 on premium experiences, the stadiums winning today are those tracking these metrics and making data-driven improvements.
The fan journey isn't linear anymore.
Your guests aren't just parking, finding their seats, and heading home. They’re:
- arriving from multiple entry points
- upgrading seats on the fly
- making food runs between plays
- hunting for merchandise
- trying to catch meet-and-greets
…all while checking their phones for the fastest route to their next destination.
Luckily, the problem isn’t that fans aren’t willing to spend more on great experiences. In fact, here's what the numbers show:
But creating those premium experiences requires understanding exactly where your operations excel and where they're falling short.
This guide is for fan experience and stadium ops leaders who need to quantify what's working and what's costing you revenue. We'll walk through 20 actionable KPIs organized across seven categories that successful stadiums track to optimize operations, boost satisfaction, and maximize ROI.
Let's break down the metrics that matter.
Looking for an indoor mapping solution to power visitor navigation, simplify operations, and improve venue analytics? Book a custom demo of Mappedin →
The 7 pillars that matter for improving fan experience
Your guest services team fields hundreds of "where is..." questions per game. Your concession lines back up during key moments. Your accessibility routes aren't clearly marked. Your premium spaces go undiscovered because fans can't find them.
Does this sound like your daily operational reality?
You can't improve what you don't measure, especially when operational costs are rising and fan expectations are higher than ever.
The stadiums winning on fan experience are doing it successfully (and sustainably) by tracking specific metrics across seven interconnected categories:
- Audit & data gathering - Establishing your baseline
- Signage & navigation - Ensuring fans can orient themselves
- Digital wayfinding - Meeting fans where they are (on mobile)
- Accessibility & inclusion - Creating equitable experiences for all fans
- Safety & emergency preparedness - Protecting fans while maintaining confidence
- Monetization & fan engagement - Converting moments into revenue
- Analytics - Continuous improvement through data
Each category contains specific KPIs that reveal operational bottlenecks, revenue opportunities, and guest satisfaction drivers. Next, we’ll cover how to track them.
20 essential fan experience metrics
Audit & data gathering
Before you can optimize your fan experience, you need to understand your current state. These foundational metrics help you identify gaps and prioritize improvements:
1. Up-to-date signage inventory. Track the accuracy and completeness of your physical wayfinding assets. Which signs are outdated? Which destinations lack clear signage? Your inventory reveals where fans are most likely to get lost.
2. Key destinations mapped. Ensure all critical locations (i.e., restrooms, concessions, exits, premium areas, accessible routes, etc.) are documented in a central system. Gaps in your mapping create gaps in your guest experience.
3. Inventory of fan/staff feedback on navigation pain points. Systematically collect and categorize directional assistance requests. Are fans consistently confused about parking-to-gate routes? Do certain sections generate more "where is..." questions? This qualitative data points you toward high-impact fixes.
4. "Where is..." question tracking. Measure how often your staff fields navigation questions per 1,000 attendees. This metric quantifies the operational cost of poor wayfinding. Every answered question is staff time that could be spent on higher-value guest interactions.
Why these matter: These baseline metrics reveal where fans struggle most and help prioritize improvements. If you're fielding 50 directional questions per 1,000 fans, that's significant staff time you could reclaim with better wayfinding.
Stadium digital signage & navigation
Traditional wayfinding elements remain critical in the digital age. Physical infrastructure provides orientation and backup when technology fails or when fans prefer analog navigation:
5. Clear, visible & accessible signage for key areas. Audit sight lines, lighting, and placement for critical directional signs. Can fans see your restroom signage from 50 feet away? Are exit signs visible in both daylight and evening lighting conditions?
6. Digital directories at key decision points. Track the presence and functionality of interactive kiosks at high-traffic intersections. Your main concourse, entry gates, and premium area entrances need decision-making tools exactly where fans pause to figure out their next move.
7. Compliant & accurate static signage. Ensure ADA compliance and information accuracy across all fixed signage. Outdated signage pointing to closed concession stands or incorrect section numbers creates frustration and operational burden.
8. High-traffic routes marked. Identify and clearly designate primary circulation paths. Your crowd flow improves dramatically when fans can follow intuitive routes from parking to gates, gates to seats, and seats to key amenities.
Why these matter: Physical wayfinding creates your foundation. Even the best digital solutions need to work in harmony with the built environment. Fans who can't orient themselves physically won't trust your digital guidance.
Stadium wayfinding
Modern fans expect mobile-first navigation from the minute they enter the venue (and even before). A robust stadium app is essential to your operational infrastructure:
9. Interactive digital map for fan mobile usage. Measure availability, feature completeness, and integration with your stadium app. Does your map include search functionality? Can fans save their section? Does it surface relevant vendors based on seat location?
10. Seamless handoff from kiosks to mobile (QR codes). Track the success rate of kiosk-to-phone route transfers. Fans shouldn't need to re-enter destinations when they move from your digital directory to their personal device. A smooth handoff means fans actually use your wayfinding tools.
11. Real-time alerts & notifications. Monitor your capability to push time-sensitive information to fans—gate changes, security updates, traffic advisories, last-minute promotions. Real-time communication keeps fans informed and reduces chaos during unexpected situations.
Why these matter: Digital wayfinding meets fans where they already are – on their phones – and enables personalized, real-time experiences impossible with static signage. Case in point, St. Louis CITY SC's interactive stadium map is the second most-used feature in their official app, driving new revenue opportunities and improved fan satisfaction.
— Aaron Brewer, Senior Product Manager, Digital Experience at St. Louis CITY SC
Accessibility & inclusion
Creating equitable experiences for all fans goes beyond compliance. It’s a step in optimizing stadium experience for everyone to enjoy:
12. ADA-compliant routes/signage. Audit and track the availability of step-free routes and accessible guidance. Can guests using wheelchairs or mobility aids navigate from every entry point to their seats, restrooms, and concessions without encountering stairs or obstacles?
13. WCAG 2.1-compliant signage. Ensure digital interfaces meet web accessibility standards for contrast, text size, and screen reader compatibility. Your digital wayfinding should work for fans with visual impairments, not just sighted users.
14. Multi-language support. Measure the availability and usage of non-English wayfinding options. Are you serving international fans, tourists, and non-English-speaking local communities? Track which languages your fans need most and prioritize accordingly.
Why these matter: Accessible stadiums serve larger audiences and reduce liability. When accessibility is built into your wayfinding infrastructure (not added as an afterthought) every fan navigates with confidence.
Safety & emergency preparedness
Building trust through visible safety infrastructure reduces panic during emergencies and creates baseline confidence during normal operations:
15. Clearly marked emergency exits, first aid & security. Track visibility and accuracy of safety-critical signage. Fans need to locate emergency resources quickly—both in crisis situations and for routine needs like first aid stations.
16. Evacuation routes in stadium wayfinding. Ensure emergency egress paths are integrated into digital and physical navigation systems. Your stadium wayfinding software should support evacuation scenarios, not just typical fan journeys.
17. Real-time safety alerts. Measure your ability to communicate urgent safety information instantly to fans in specific zones. Can you notify only Gate A about a closure without alarming the entire stadium? Targeted alerts prevent mass confusion.
Why these matter: Safety infrastructure must be both present and discoverable. Fans need to find exits quickly in emergencies and feel secure throughout their visit. Clear safety wayfinding reduces staff burden during routine incidents and enables faster response during serious situations.
Monetization & fan engagement
Here's where navigation moments become monetization moments. When done thoughtfully, wayfinding drives revenue:
18. Sponsorship opportunities in wayfinding. Track sponsored route availability and partner integration within digital maps. Are you surfacing sponsor locations at relevant decision points? Can brands pay for premium placement in navigation experiences?
19. Ads/promotions highlighted in wayfinding. Measure promotional placement within navigation experiences—contextual offers, premium upgrades, limited-time concession deals. When a fan searches for "beer," are you highlighting your premium craft beer vendor or the sponsor activation nearby?
Why these matter: Fans are already using wayfinding to decide where to go next. Surfacing relevant offers at that exact moment (i.e., when they're choosing between concession stands or considering a premium club upgrade) converts interest into revenue without feeling intrusive.
Source: PwC fan experience & revenue survey
Analytics
Closing the loop with measurement transforms your wayfinding from a static tool into a continuously improving system:
20. Wayfinding/map analytics. Track map sessions per user, search queries, route completions, and feature adoption. Which destinations do fans search for most? Where do they abandon routes? What features never get used?
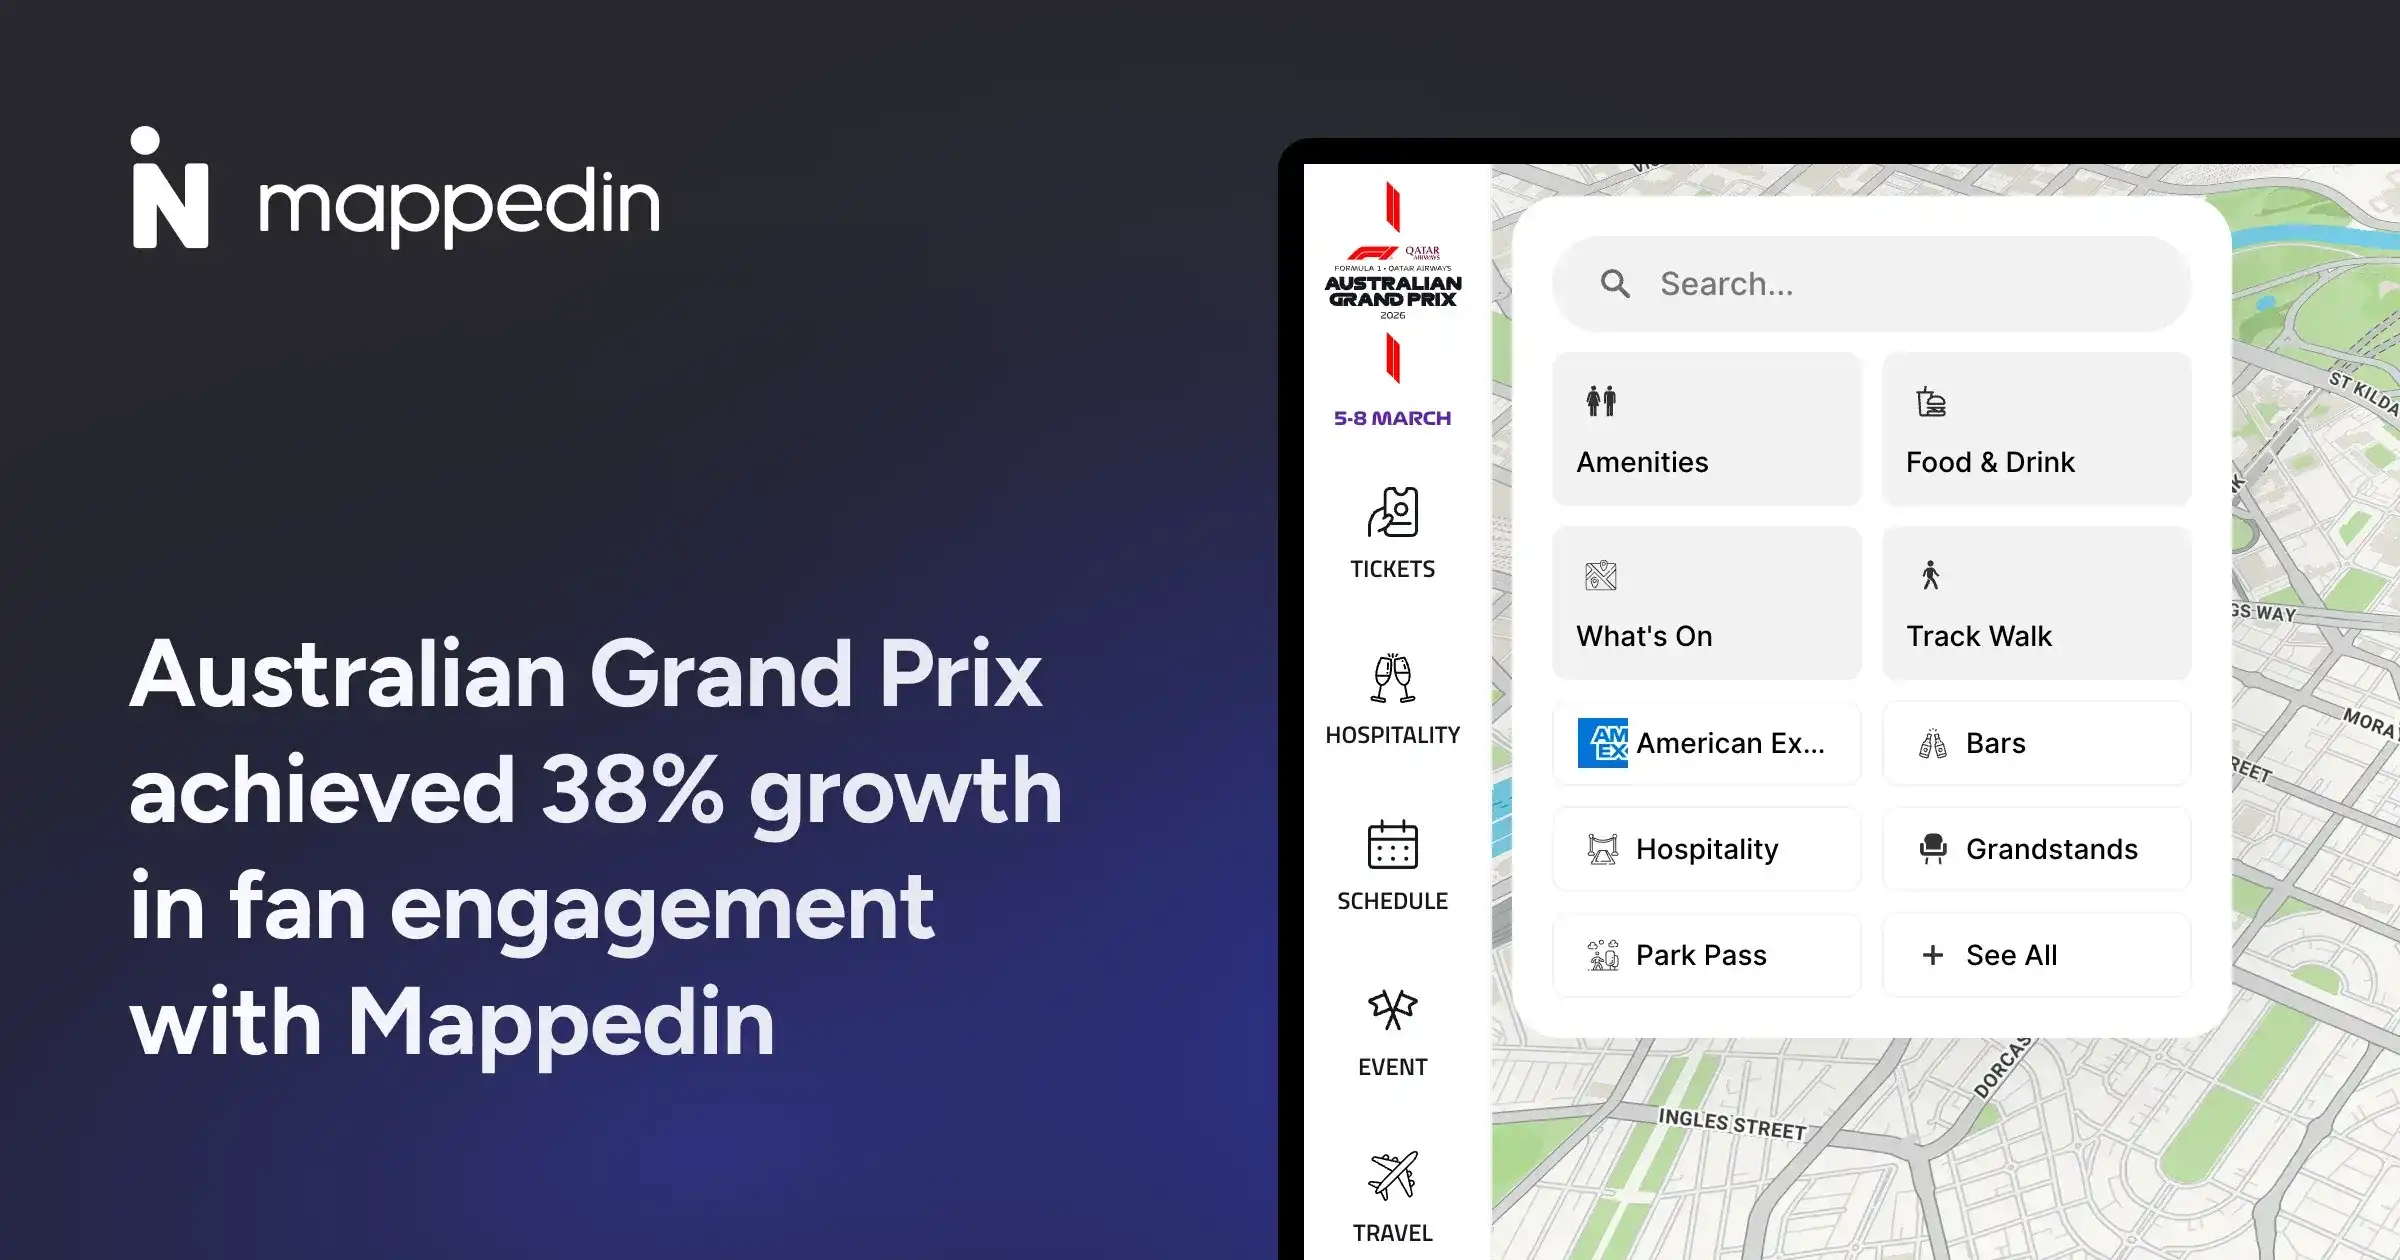
Why this matters: Analytics reveal what fans actually need versus what you think they need. Formula 1 Australian Grand Prix saw 327,000+ unique map sessions with 73% of fans using the digital map. That's quantifiable engagement that drives decision-making.
FAQs about fan experience & stadium wayfinding
What's the most important fan experience metric to start tracking?
Start with "where is..." question tracking and map analytics. These reveal where fans struggle most and provide a baseline for improvement. If you're not tracking how often guests ask for directions, you're missing the clearest signal of wayfinding failure.
How do we balance static signage with digital signage and wayfinding?
They're complementary, not competitive. Physical signage provides orientation and backup when technology fails or when fans prefer analog navigation. Digital wayfinding offers personalization, location-based advertising opportunities, real-time updates, and detailed routing. The best fan experiences use both: physical signage for orientation and critical safety information and digital tools for personalized journeys.
What's a realistic timeline to see ROI from improved fan experience metrics?
Most stadiums see measurable improvements within one season:
- Reduced staff questions
- Increased concession spend
- Higher satisfaction scores
Formula 1 Australian Grand Prix saw 44% more map sessions year-over-year, demonstrating rapid adoption when wayfinding meets fan needs.
How often should we review these metrics?
Review analytics after each event for immediate operational adjustments. Conduct quarterly deep dives to identify trends and seasonal patterns. Perform annual comprehensive assessments tied to the Modern Fan Experience Scorecard to benchmark progress and set priorities for the coming year.
Start measuring what matters for fan experience
These 20 metrics provide a comprehensive framework for understanding and improving every aspect of the fan journey, from the moment guests arrive at your parking lots to the moment they exit after the final whistle.
The stadiums winning on fan experience aren't hoping for better results or guessing what will move the needle.
They're tracking these metrics, identifying bottlenecks, and making data-driven improvements. CITYPARK achieved an 84% fan satisfaction rate with their Mappedin-powered digital maps. Formula 1 venues are engaging hundreds of thousands of fans through Mappedin’s wayfinding technology.
Those results came from measuring what matters and acting on the data.

Share