

A shopper enters a mall, finds the store they came for, makes a purchase, and leaves without seeing the surrounding tenants. The visit counts as footfall, but it may produce little dwell time, limited exposure for other retailers, and no reason to return. A busy entrance can hide a weak retail journey.
That distinction matters to operations, leasing, and marketing teams. Footfall in retail is useful, but a headcount alone can't show whether people are passing through, browsing, finding the right stores, or buying. Indoor maps, wayfinding tools, and location analytics, including platforms like Mappedin, can add context by showing how visitors move through a venue and which destinations they seek.
The practical questions are:
- What kind of visit did the venue create?
- What did that visit make possible?
The answer depends on measurement quality, shopping intent, dwell time, conversion, weather, format, and micro-location.
Why footfall quality matters more than quantity
A retail manager may see a healthy daily count while tenants report weaker sales. Leasing may point to a popular entrance, while marketing sees weak engagement with secondary zones. Operations may notice that visitors cluster near food and entertainment but rarely reach upper floors.
In this scenario, all three teams can be correct because they're looking at different parts of the same movement pattern.
A person entering a shopping centre is not automatically a potential customer for every tenant. They may be visiting a restaurant, collecting an order, attending an event, using a service or taking a shortcut. The count records presence, not purpose.
That makes visit quality more useful than volume when a venue needs to decide where to place staff, signage, campaigns, or new tenants.
A useful quality view combines several questions:
- Who arrived for shopping: Was the visitor there to browse, transact, dine, work, or pass through?
- Where did the visitor go: Did they reach the intended store, explore adjacent zones, or stop at the first destination?
- How long did the visit last: Did the venue support meaningful browsing, or did friction shorten the journey?
- What happened afterward: Did the visit lead to a transaction, a larger basket, a return visit, or no measurable commercial outcome?
This approach also prevents unfair comparisons. A retail park, high street, and enclosed shopping centre serve different trip types and respond differently to weather, transport, tenant mix, and local routines. A competitor's camera analytics may provide richer movement data, while a simpler doorway counter may be more affordable and easier to govern. The right system depends on the question the team needs to answer.
The sections that follow move from definition to measurement, then from measurement to interpretation and action. The goal is a calm operating framework that helps venue teams identify whether traffic represents passers-by, browsers or buyers, and connect that distinction to revenue and day-to-day risk.
What footfall in retail means
Footfall is the number of people entering a shop or shopping area in a given time. A shopping centre can report rising visitor numbers while several stores don't see change at the tills. The count may include people heading to dining or leisure areas, crossing a concourse, or sheltering from bad weather. Footfall is a useful signal, but it is not a verdict on trading performance.
In plain language, footfall means the number of people entering a shop, shopping centre, retail park, or other defined area during a particular period. A retailer may count entries through one door, while a property team counts visitors across entrances, floors, or zones.
The boundary needs to be documented before results are compared. A centre-wide count and a store-entry count answer different questions. Someone entering a car park, atrium, or tenant unit should not be included in the same measure unless the design explains what the count represents.
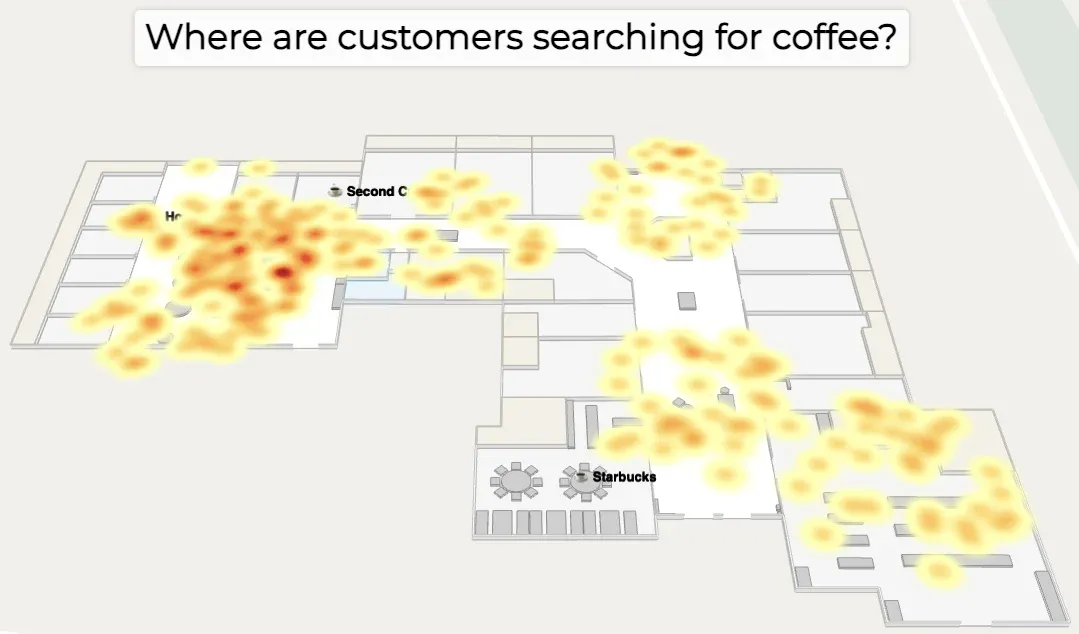
Why retail teams track footfall
Footfall gives teams an early view of physical demand. While Sales show what reached the till, footfall shows how many potential visits entered the environment before store choice, product availability, service, pricing, or checkout friction shaped the outcome.
Small shifts can change operational decisions in a mature market. Low footfall increase numbers can affect staffing assumptions, tenant conversations, campaign evaluation, and expectations for sales opportunity, especially when the change is consistent rather than isolated.
What footfall doesn't tell a team
Footfall doesn't show sales, shopping intent, product interest, or tenant-level performance by itself. Weather, retail format, transport patterns, and a unit's micro-location can also distort headline growth. A covered centre may gain visits during rain, while an open-air retail park may lose them even if demand for its stores remains steady.
A centre can attract many people who spend time in dining, leisure, or transit areas without giving every retailer equal exposure. A useful report separates traffic volume from commercial quality, then examines transactions, dwell time, basket value, movement between zones, and the difference between people who pass a storefront and people who enter it.

How smart malls turn foot traffic into sales
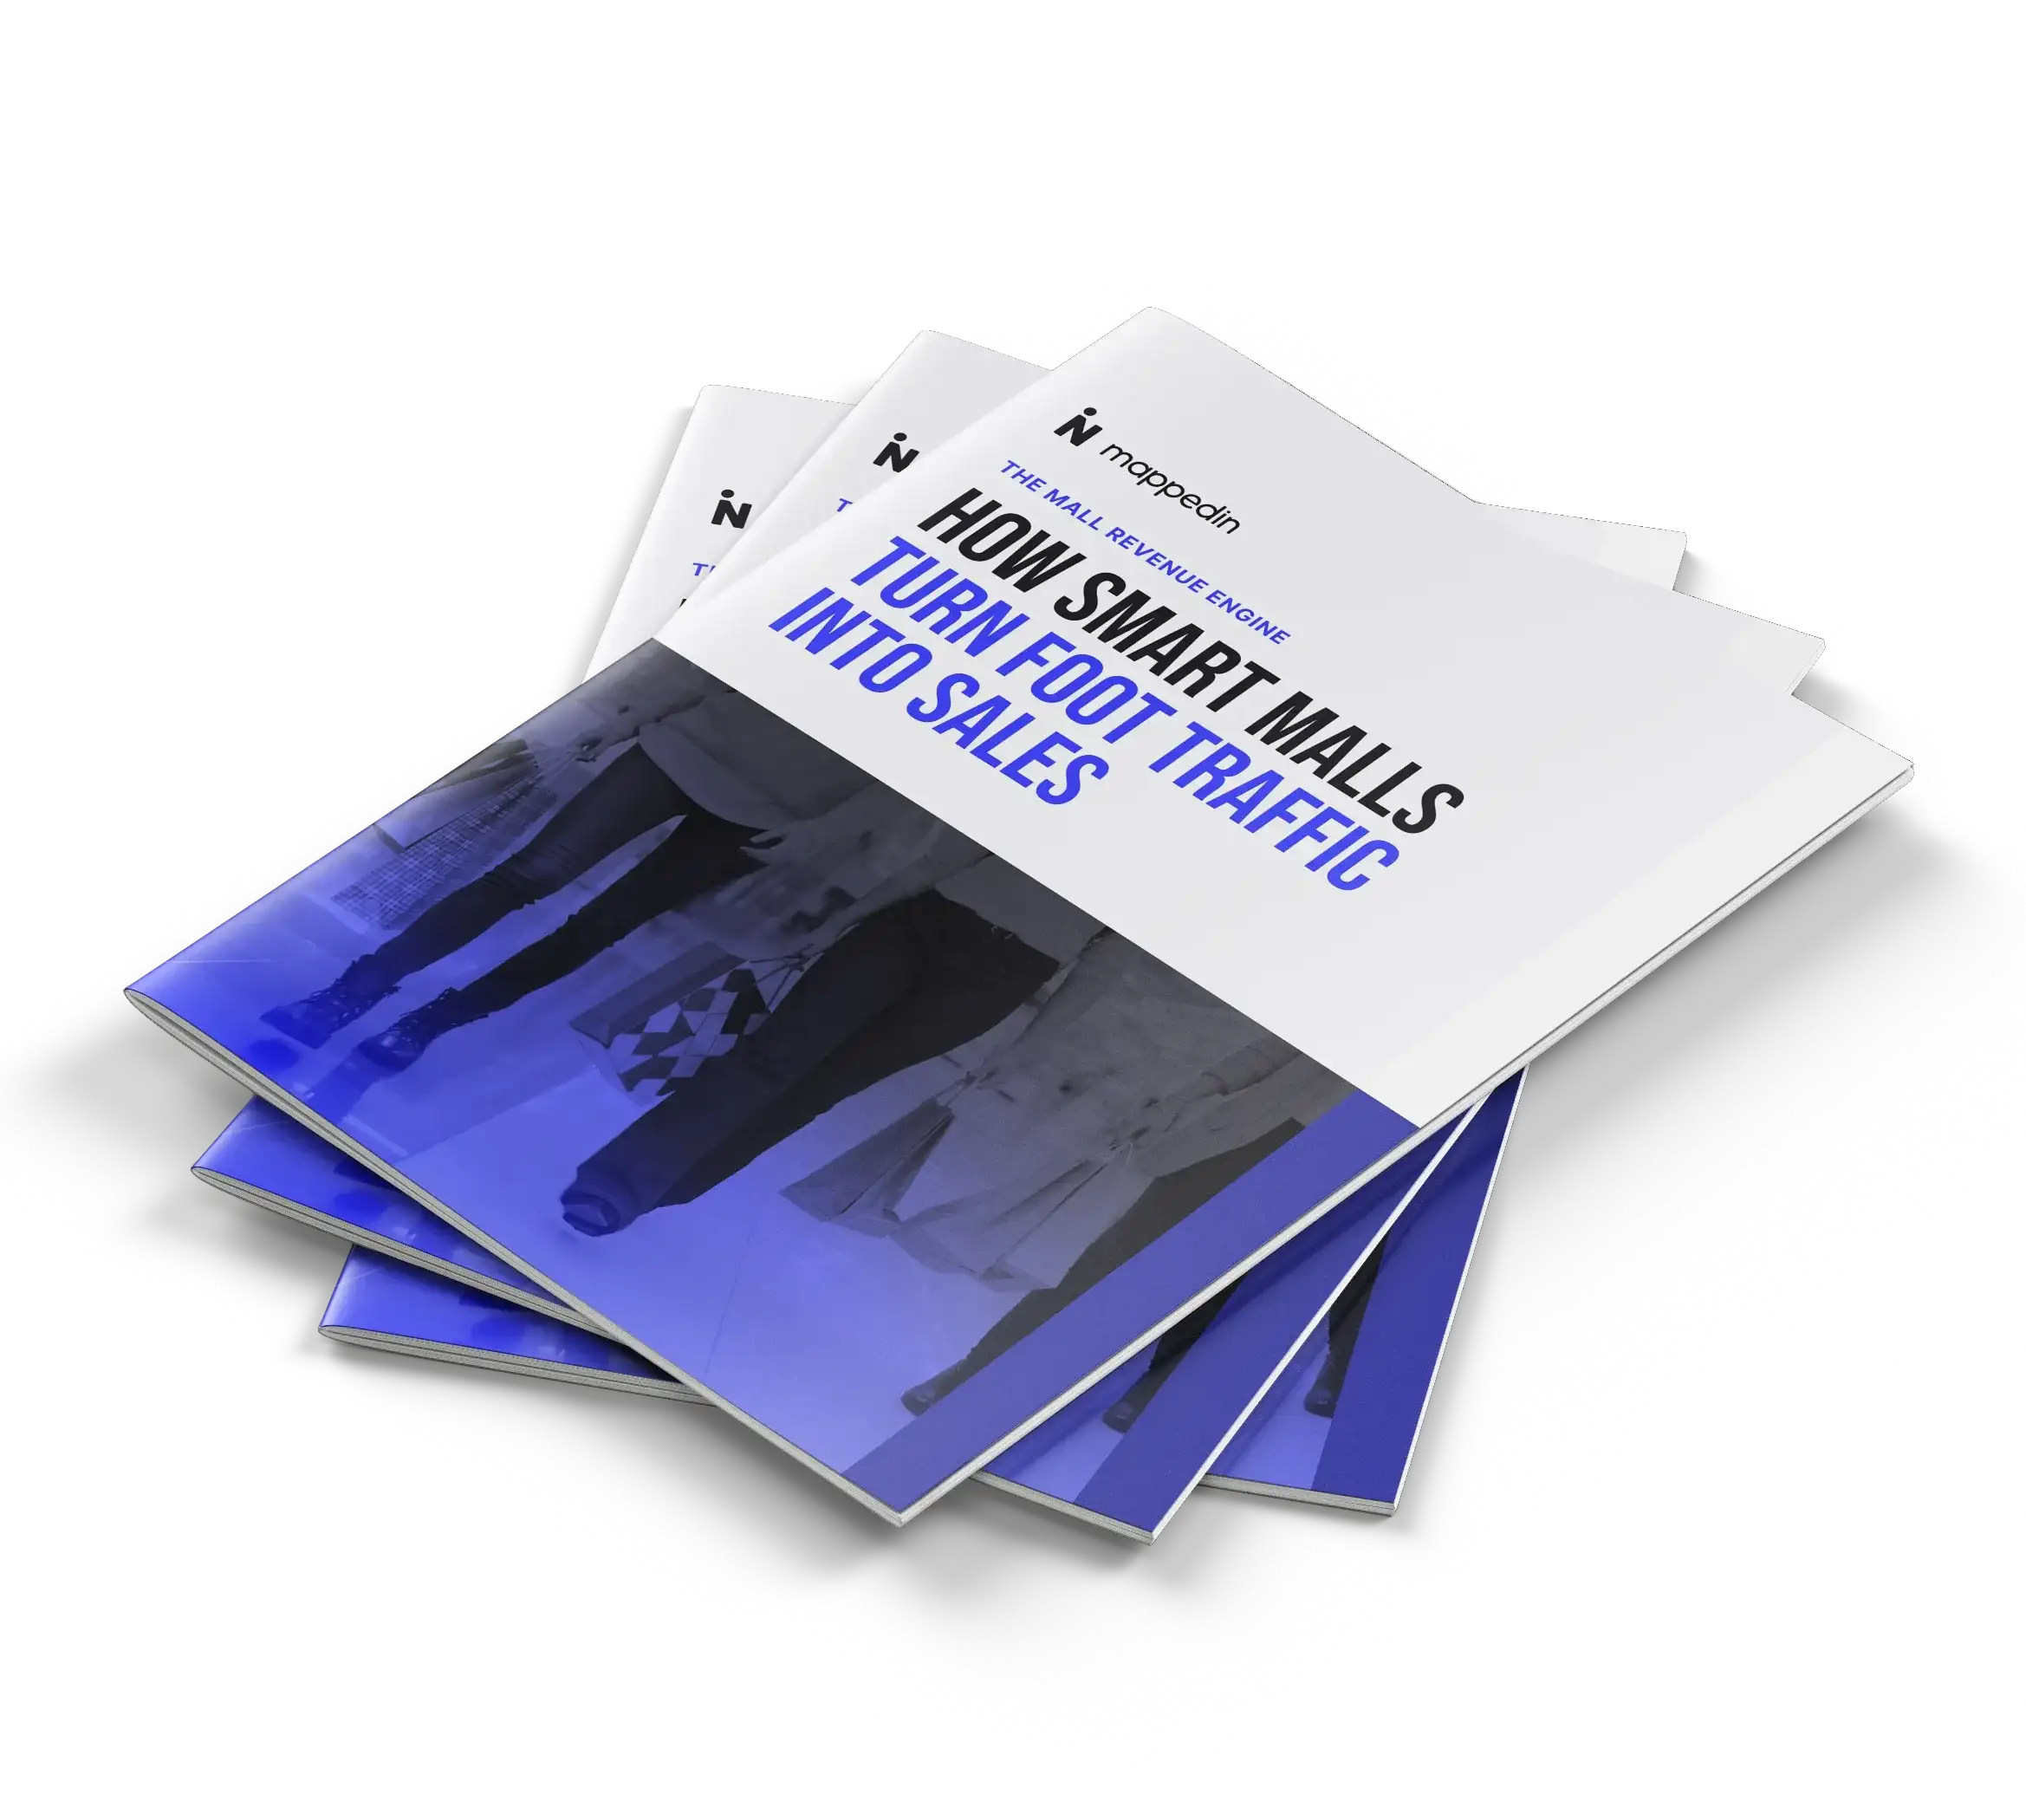
Malls aren't dead. But the strategies behind driving mall revenue? They're critically out of date. This guide makes the case for the one tool most operators have systematically underestimated, and shows exactly how to use it to drive revenue at every stage of the visit.
How to measure footfall in retail
The measurement method should follow the operational question. For example:
- A store that needs a reliable entry count may not need device tracking
- A landlord studying movement between floors may need broader coverage
- A marketing team measuring campaign quality may need footfall connected to transactions and destination searches
Four common approaches to measuring footfall in retail
1. Break-beam or infrared sensors count movement across a defined doorway or boundary
They're relatively straightforward to install and can provide a consistent baseline for a single store or entrance. Their limitation is scope. They generally won't explain dwell time, visitor identity, route choice, or whether someone crossed the beam while leaving rather than entering unless the setup distinguishes direction.
2. Wi-Fi and Bluetooth signals use nearby device detections to estimate visits, dwell, and repeat presence
They can cover broader areas than a door counter, but the result depends on device settings, signal availability, data governance, and the method used to distinguish people from devices. Privacy requirements also need careful review.
3. Camera analytics use computer vision to count people and analyze movement
They can reveal direction, queues, zones, and bottlenecks, but they introduce higher technology, governance, and privacy considerations. A camera may offer rich information, yet the venue still needs clear retention rules, signage, access controls, and accuracy checks.
4. POS correlation links traffic with transactions
It doesn't replace a footfall source. Instead, it turns traffic into a commercial denominator for conversion analysis. The result is only as reliable as the alignment between the counted area, store boundary, time period, and point-of-sale data.
Once footfall data is captured, an indoor mapping platform for retail like Mappedin can then place traffic observations against stores, entrances, amenities, accessible routes, and floors.
Key footfall metrics to measure
A count becomes actionable when it connects to a business outcome. Three measures form a practical starting point:
- Conversion rate
- Dwell time
- Basket value
The three-measure operating view
1. Conversion rate
If traffic rises while transactions remain flat, the issue may involve product availability, pricing, layout, service capacity, or the type of visitor arriving. If traffic falls but conversion improves, the store may be attracting fewer people with stronger purchase intent.
2. Dwell time
A short visit may be appropriate for a convenience-led trip, but it may signal weak discovery in a fashion or experiential environment. Dwell should be read with zone and store data because a visitor can spend considerable time in a centre without spending meaningful time near a particular tenant.
3. Basket value
A campaign that brings visitors into a store but shifts purchases toward lower-value items may look successful in a traffic-only dashboard while producing limited commercial benefit.
Build a baseline before making changes
Teams should define the counted boundary, reporting period, entrance, floor, and tenant group before comparing results. Segmenting by entrance and zone prevents a popular food hall from masking weak traffic near smaller stores.
A location analytics layer can help teams connect counts with searches, destinations, and movement patterns. Mappedin location analytics is one example of a tool category that places visitor behavior against a venue map. The important principle is vendor-neutral: the dashboard should help a team explain why a KPI moved, not merely display that it moved.
How to use footfall insights for operations, leasing and marketing
Measurement only earns its place when a team changes a decision. Operations, leasing, and marketing should use the same evidence differently because each group controls a different part of the visitor journey.
Operations
Operations teams can compare traffic by entrance, floor, hour, and destination. That view supports staffing and cleaning schedules, queue management, security coverage, and accessibility planning. If visitors cluster at one doorway and struggle to reach upper-floor tenants, clearer signs, directory updates, accessible route information, or a better-supported lift approach may improve exposure without changing the tenant mix.
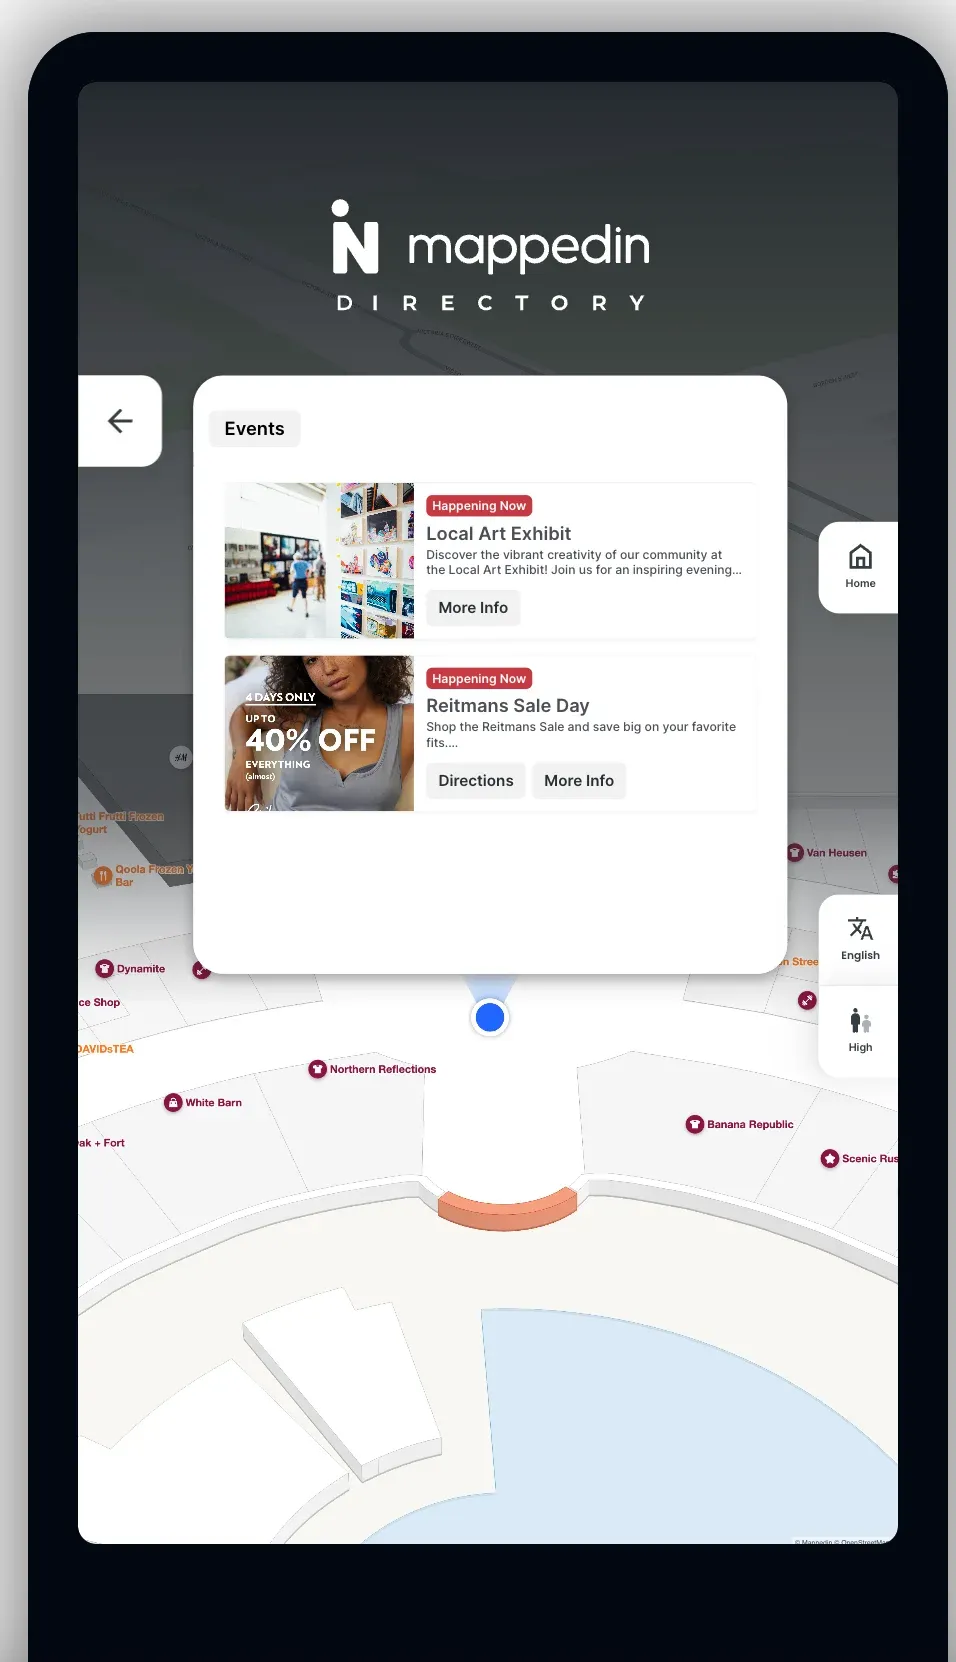
Wayfinding also affects staff workload. Repeated questions about a store, restroom, pickup point, or accessible entrance can signal a navigation problem. A map-based digital directory can reduce avoidable friction, but it shouldn't replace visible physical signs or staff assistance for visitors who need it.
Leasing
Leasing teams need more than a centre-wide headline. They need traffic evidence by zone, frontage, floor, and nearby destination. That information can support tenant-mix decisions, reveal underused space, and make lease discussions more specific.
It can also prevent a weak location from being marketed with a broad centre average that doesn't reflect the shopper flow around the unit.
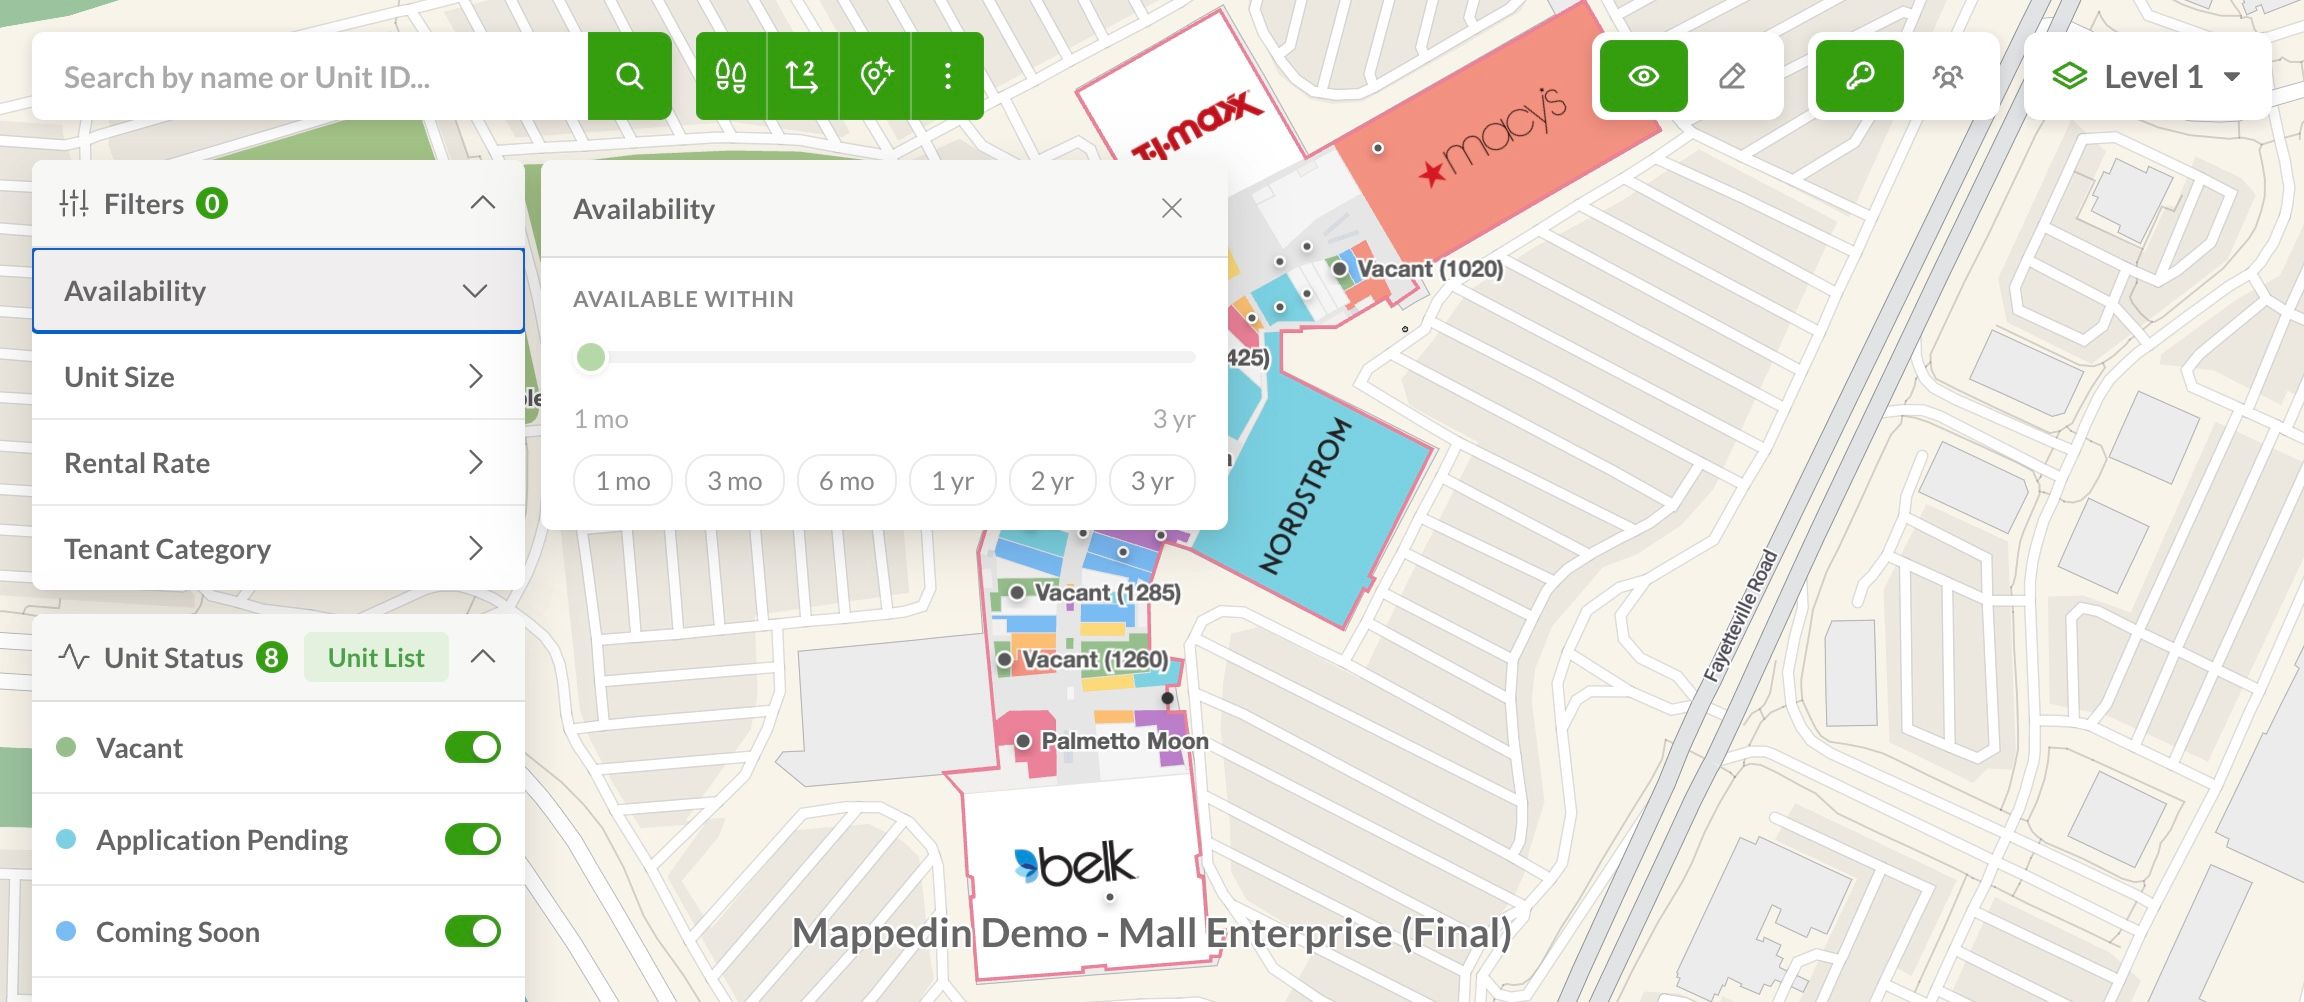
Mappedin is designed for teams to visualize floor plans, available space, destinations, and visitor behavior in one unified view. The trade-off is that mapping software still depends on accurate floor data, reliable integrations, and an agreed interpretation of what a visit means.
Marketing
Marketing teams should measure findability before campaign response. A promotion may create more visitors but send them to an already busy zone, while a destination campaign could distribute traffic toward overlooked tenants. Store discovery, event timing, offers, and cross-tenant promotion can be evaluated against traffic quality rather than raw attendance.
A practical workflow is to:
- Document the baseline
- Define the target zone
- Record the campaign window
- Compare traffic with store entries and transactions
Real world examples that show footfall ROI
A shopping centre notices that visitors enter through the main atrium, spend time near dining, and leave without reaching a group of upper-floor tenants. The operations team checks routes and destination searches before changing staffing. After improving directory information and route visibility, the team evaluates store entries, dwell by zone, and conversion rather than claiming success from centre traffic alone.
A retailer sees stable entries but weaker transactions. POS correlation shows that conversion is the issue, not a shortage of visitors. The store reviews staffing at busy periods, product availability, and the path from entrance to key ranges.
The result is assessed through conversion and basket value, with footfall retained as context.
A leasing team compares a retail park with an enclosed centre and avoids applying one recovery assumption to both.
The operating principles are straightforward:
- Count consistently: Define boundaries and maintain comparable periods.
- Measure intent: Separate passers-by, entrants, browsers, and buyers.
- Read context: Check weather, format, geography, and micro-location.
- Act by role: Give operations, leasing, and marketing decisions they can own.
- Test outcomes: Track conversion, dwell, basket value, and destination reach after changes.
Use Mappedin to increase and measure retail footfall
With Mappedin, retail operators get indoor mapping, wayfinding, and location analytics tools that help connect floor plans with destinations, visitor searches, routes, and foot traffic patterns.
Want to see this across your properties? Contact us to get started.
Related resources:


Share